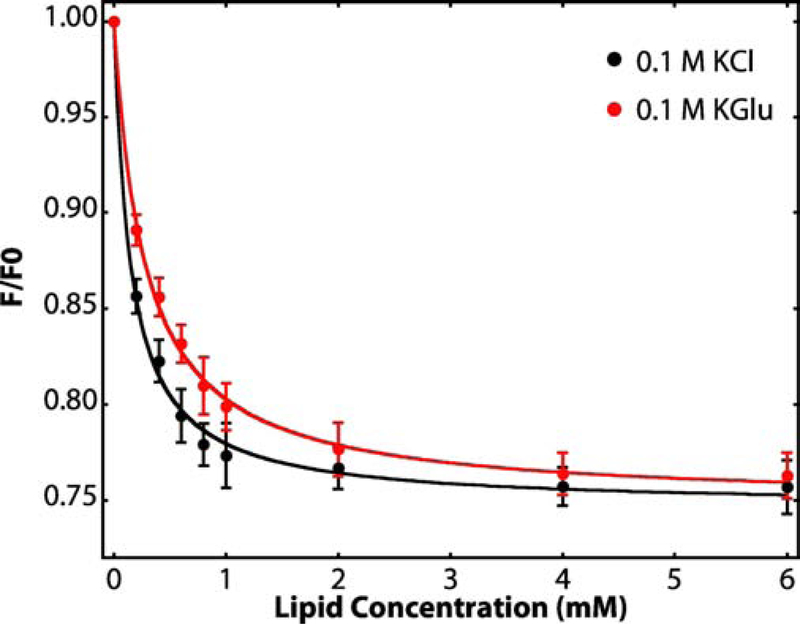
Figure 2. Titration of SecA solutions with large unilamellar vesicles (LUV) reveals strong interactions of SecA with LUV formed from E. coli lipids.
Relative tryptophan fluorescence intensity changes (F/F0) accompanying the titration of aqueous solutions of SecA (4 μM) with large unilamellar vesicles (LUV) formed from E. coli lipids at 37 °C. The black curve shows partitioning data for SecA in 0.1 M KCl. The red curve shows the partitioning of SecA in 0.1 M KGlu (potassium glutamate). We showed earlier [45] that KGlu stabilizes SecA against thermal unfolding. F0 is the florescence intensity in the absence of vesicles and F the intensity in the presence of vesicles. The intensities are corrected for light scattering effects [50] (Equation 1, see Methods). The curves are non-linear least-squares fits of Equation 2 to the data from which the mole-fraction partition coefficients Kx are derived. Free energies of transfer ΔGwb of SecA from the aqueous phase to lipid vesicles can be calculated from Equation 3. Fluorescence intensities were recorded between 310 and 400 nm (4 nm slit) using excitation at 295 nm (1 nm slit). For determination of F/F0, we used the fluorescence intensity at 340 nm [50]. Three independent sets of experiments were performed for each electrolyte condition. The error bars represent the standard errors of the mean (SEM) resulting from these independent measurements. Values of Kx and ΔGwb determined from these measurements are summarized in Table 1.

