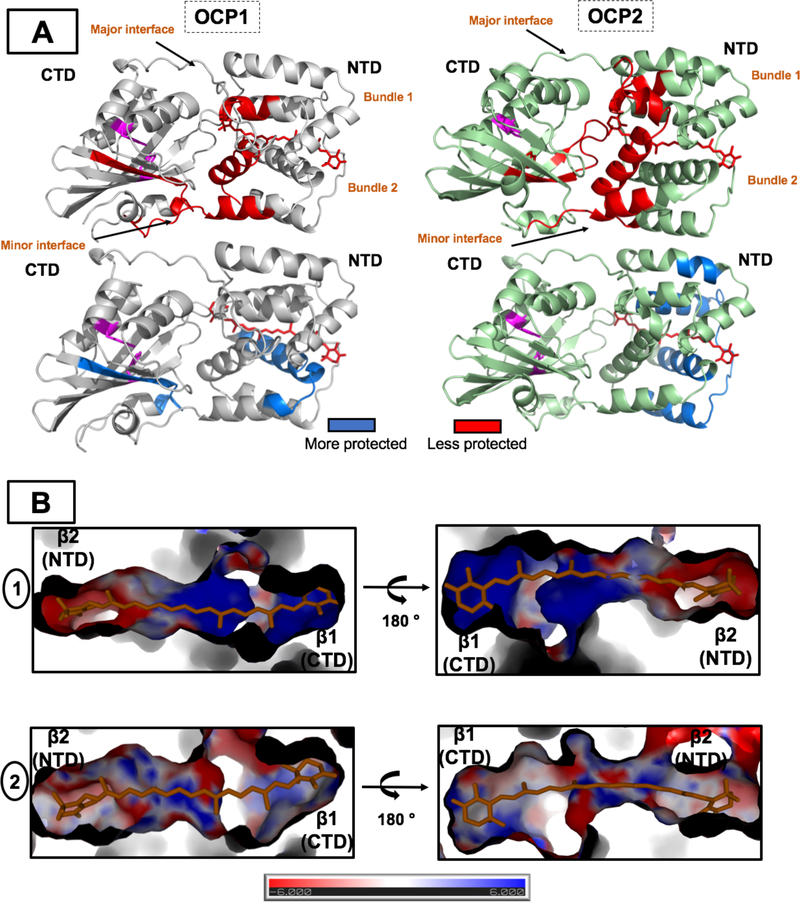
Figure 7: A. Local structural changes in the Tolypothrix OCP1 and OCP2 upon light activation as measured by XFMS.
The changes in solvent accessibility (> 1.5-fold changed) upon light activation are plotted on the OCP1 crystal structure (PDB 6PQ1) and on the OCP2 homology model showing regions becoming less protected (red) and more protected (blue). The carotenoid in OCPR form is shown in red sticks. The domain separation is not shown. The conserved Y201 and W288 are highlighted in magenta. B. Charge distribution of the carotenoid tunnel in OCP1 (1) and OCP2 (2). β1 and β2 regions are highlighted. It is colored by electrostatic potential from −6kT/e (red) to 6kT/e (blue).

