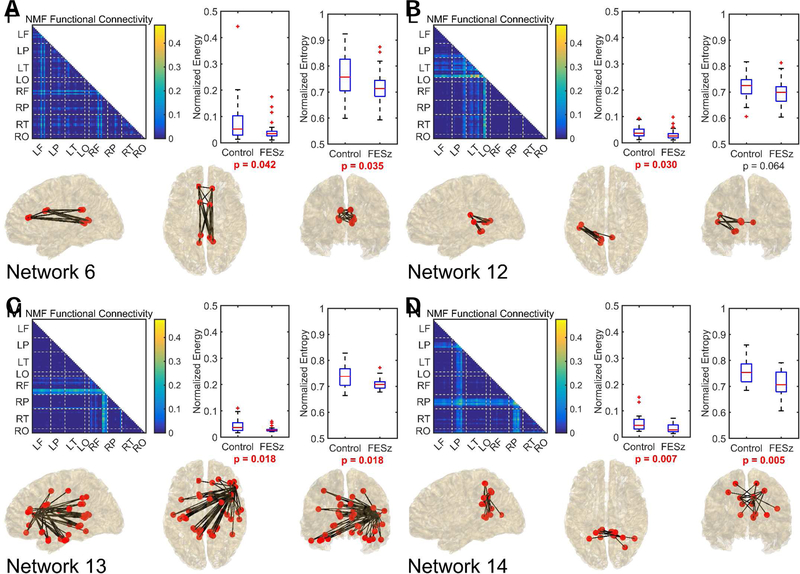
Figure 3.
The 4 networks that differentiated healthy individuals from first episode schizophrenia spectrum individuals. Networks are represented as a connectivity graph and anatomically on a brain model. Control and first episode schizophrenia-spectrum (FESz) group comparisons of energy and entropy are also provided. In the connectivity graph, each pixel represents a phase-locking relationship between two Brodmann areas. Values closer to the diagonal represent local communication while values in lower left represent cross-hemisphere communication. To further improve an anatomical understanding, dashed lines divide Brodmann areas from different lobes and are identified at the axes by their hemisphere (R-right, L-left) and lobe (F-frontal, P-parietal, T-temporal, O-occipital). The top third of connections by strength are also shown within the brain at sagittal, axial, and coronal views. FieldTrip software (72) was used in generation of these brain visuals. Energy and entropy values have been normalized between highest and lowest observed values across subjects and the p-value associated with the Wilcoxon rank-sum test is given. Comparisons with p < 0.05 are in bolded red text.

