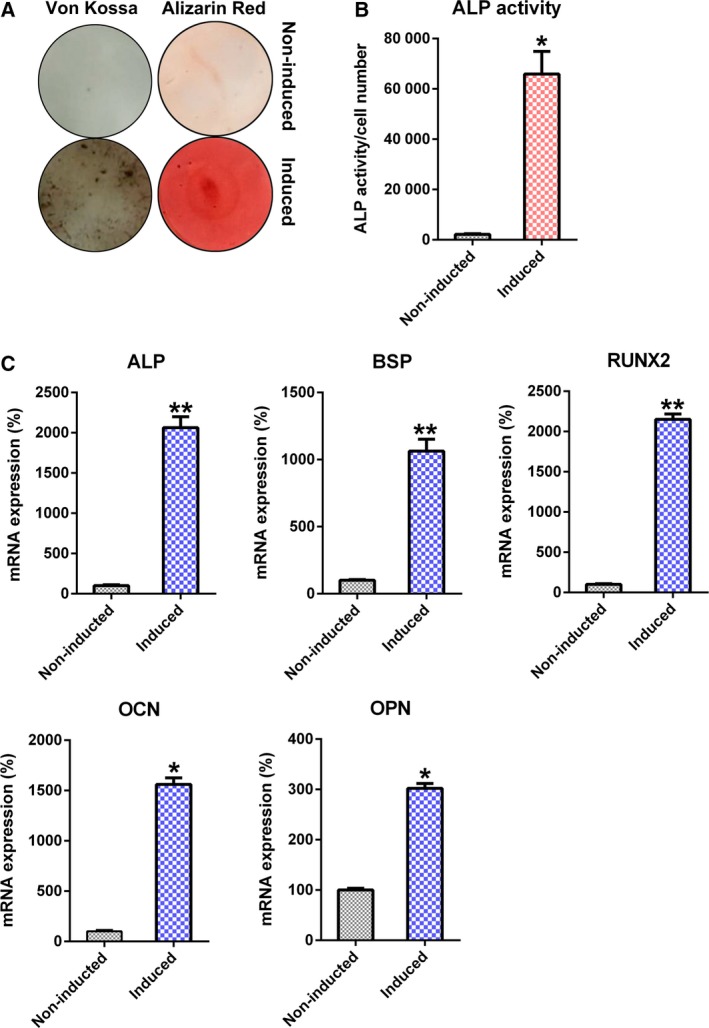
Figure 1.

Osteoblastic differentiation of hBMSCs. Osteogenic differentiation was triggered in hBMSCs. (A) Alizarin Red staining and von Kossa staining results at the 14th day subsequent to stimulation. (B) ALP function in osteoblastic differentiation. (C) qRT‐PCR of OCN, OPN, RUNX2, BSP and ALP, and glyceraldehyde‐3‐phosphate dehydrogenase normalization at certain time points after stimulation. These tests were repeated three times. Differences were assessed by two‐tailed Student's t‐test. Error bars represent SD. *P < 0.05, **P < 0.01 versus noninduced groups.
