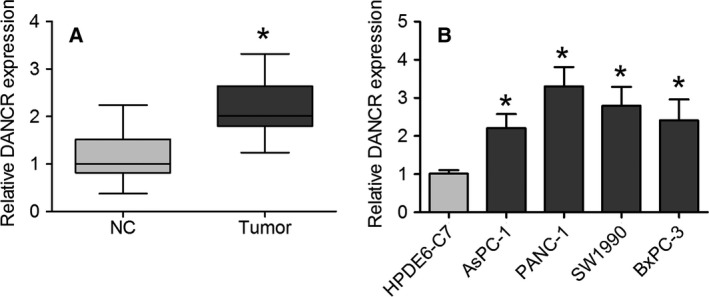
Figure 1.

DANCR expression is increased in PC tissues and cell lines. (A) Expression of DANCR was measured using qRT‐PCR in PC tissues and healthy adjacent tissues. Data are expressed as mean ± SD, Student's t‐test. (B) qRT‐PCR analysis was used to determine DANCR expression in AsPC‐1, PANC‐1, CFPAC‐1, SW1990, BxPC‐3, and HPDE6‐C7 cell lines. Data are presented as mean ± SD of fold change, one‐way ANOVA. *P < 0.05.
