
Figure 7.
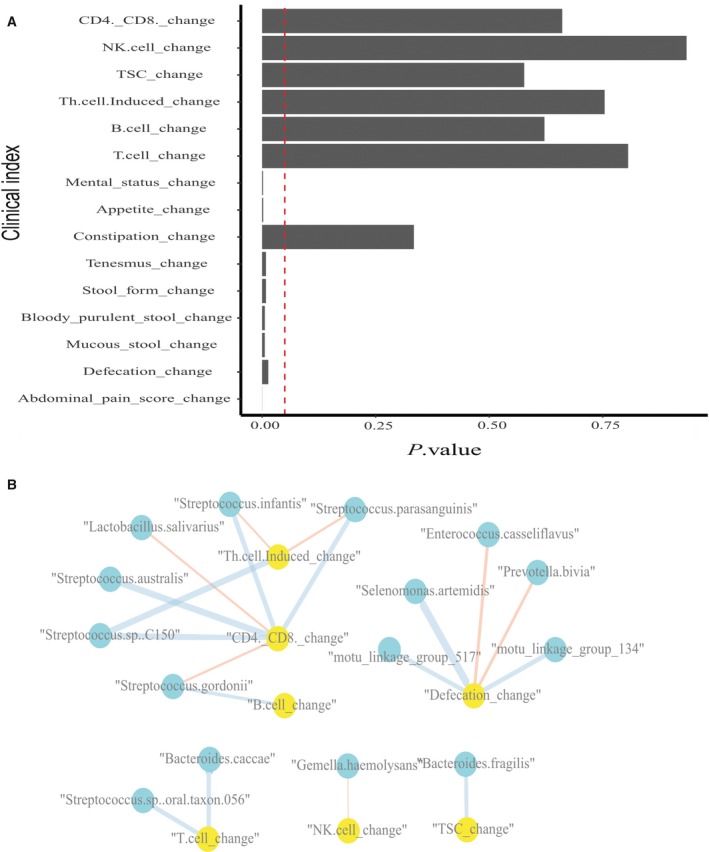
Some clinical indexes of IBD recipients have significantly changed 3 days after FMT, and several clinical indexes correlated with changes in the mOTU profiles of recipients. (A) Mental status, appetite, tenesmus, etc. significantly changed 3 days after FMT (P‐value < 0.05). Vertical dotted line indicates a P value of 0.05. (B) Defecation changes and CD4+/CD8+ changes have relationships with several mOTUs. Blue represents a significant positive correlation, while red indicates a significant negative correlation (P‐value < 0.01). Blue indicates gut microbiota species, while yellow indicates clinical indexes. The width of the lines indicates the weight of correlation.