
Figure 2.
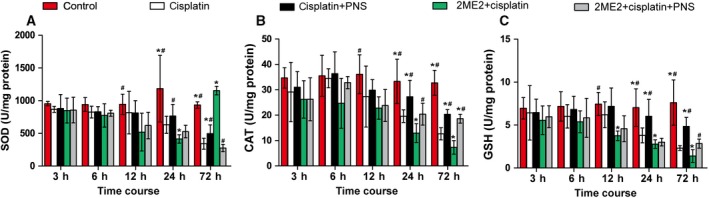
The levels of SOD (A), CAT (B) and GSH (C) in renal tissues from rats at each time point. *P < 0.05 compared with the cisplatin group; # P < 0.05 compared with the 2ME2 + cisplatin group. Data were indicated as mean ± SD (n = 6) and analyzed by one‐way ANOVA.