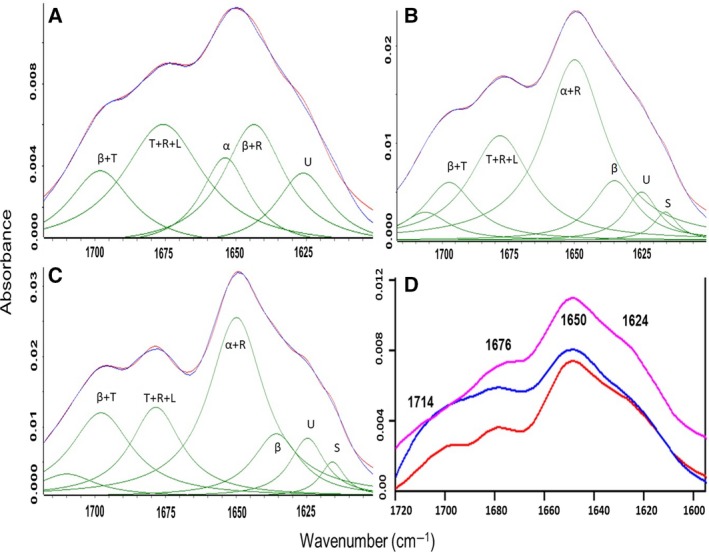
Figure 4.

FTIR absorbance spectra of the PE35–PPE68 pair reveal an increase in structural order upon interaction: Curve fittings of the absorption spectrum of PE35, PPE68, and PE35–PPE68 are presented in A, B, and C, respectively. In the above curve fit, blue color depicts the original spectrum and red color indicates the quality of fit which results from protein secondary structural changes (green bands). Secondary structure content should be read as α: alpha helix; β: beta sheets; L: loops; T: turns; R: random coils; U: unstructured; and S: amino acid side chain. D represents average infrared absorption spectra of PE35, PPE68, and PE35–PPE68 complex and depicted in red, pink, and blue color, respectively.
