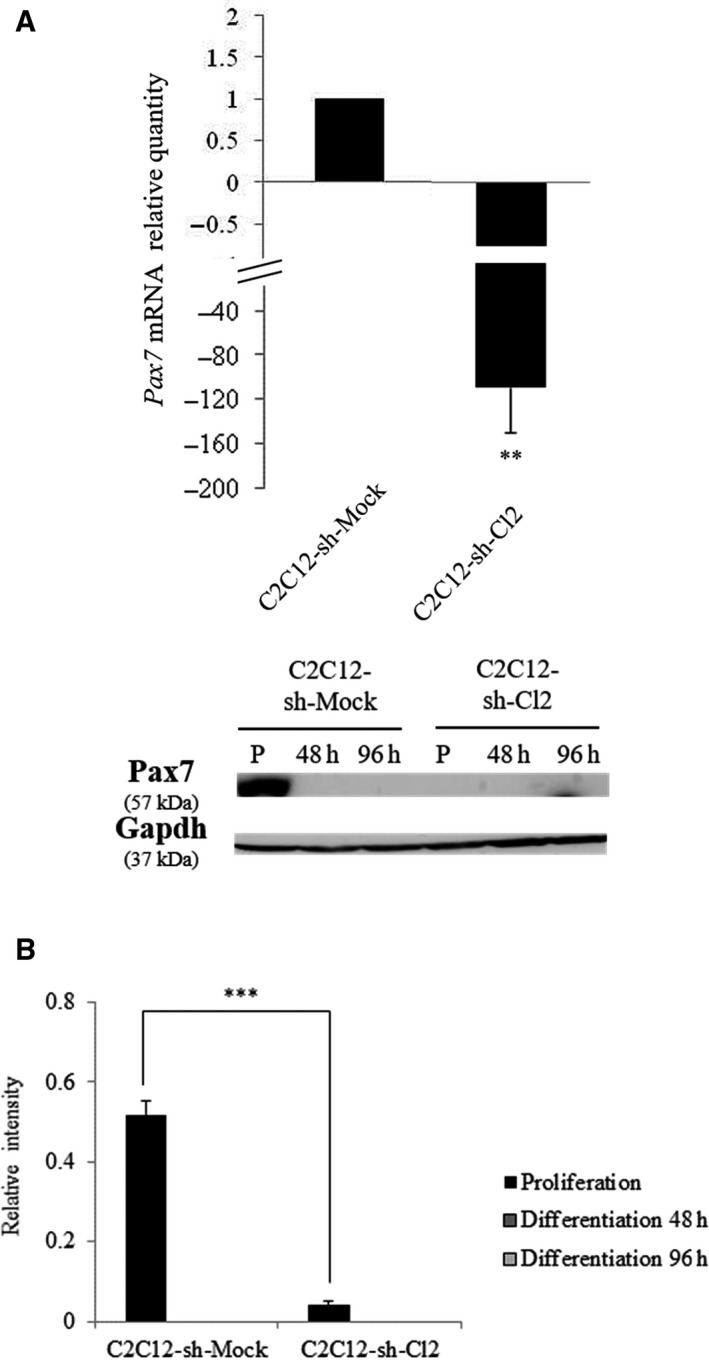
Figure 5.

Knockdown of st6gal1 reduced Pax7 expression. (A) Expression of Pax7 in C2C12‐sh‐Mock and C2C12‐sh‐Cl2 in proliferation. Fold changes are expressed relative to C2C12‐sh‐Mock cells. Data are expressed as relative transcript amounts corresponding to the ratio of C t values for C2C12‐sh‐Cl2 cells and C t values for C2C12‐sh‐Mock cells and normalized against the expression of gapdh transcript. Experiments have been done three times (n = 3). **P < 0.01; ***P < 0.001. (B) Relative Pax7 amounts determined by western blot using total cell proteins isolated from C2C12‐sh‐Mock and C2C12‐sh‐Cl2 in proliferation (P) and differentiation at 48 and 96 h. Protein levels were determined in comparison with gapdh loading control. Experiments have been done three times (n = 3). Means ± SEMs are shown (two‐tailed t‐test, with a significant level of **P < 0.01; ***P < 0.001).
