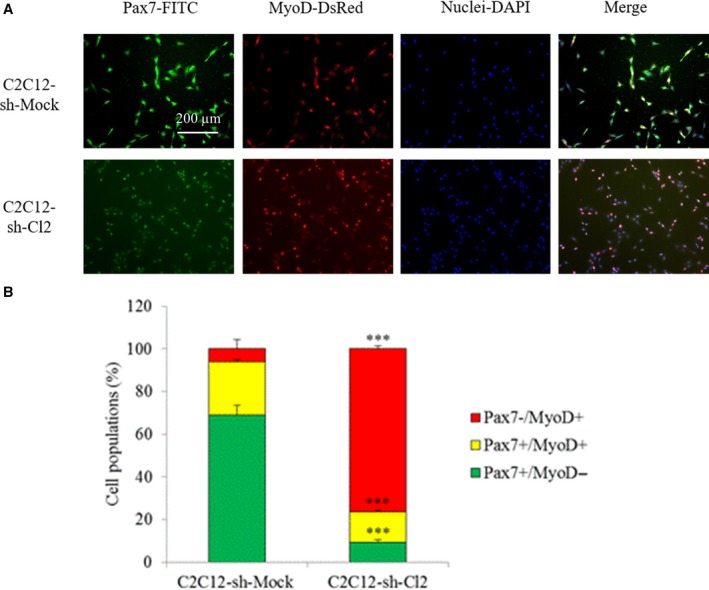
Figure 6.

Effect of st6gal1 knockdown on cell fate. (A) Co‐immunostaining of Pax7 (green) and MyoD (red) in C2C12‐sh‐Mock and C2C12‐sh‐Cl2 cells during proliferation. The exposure times were identical for a same staining between the two cell types (1000 ms for Pax7‐FITC and 500 ms for MyoD‐DsRed); scale bar: 200 µm. (B) Percentages of Pax7+/MyoD−, Pax7+/MyoD+, and Pax7−/MyoD+ cell populations during proliferation. Percentages are the mean of counting on seven fields by condition. Experiments have been done three times (n = 3). Means ± SEMs are shown (two‐tailed t‐test, with a significant level of ***P < 0.001).
