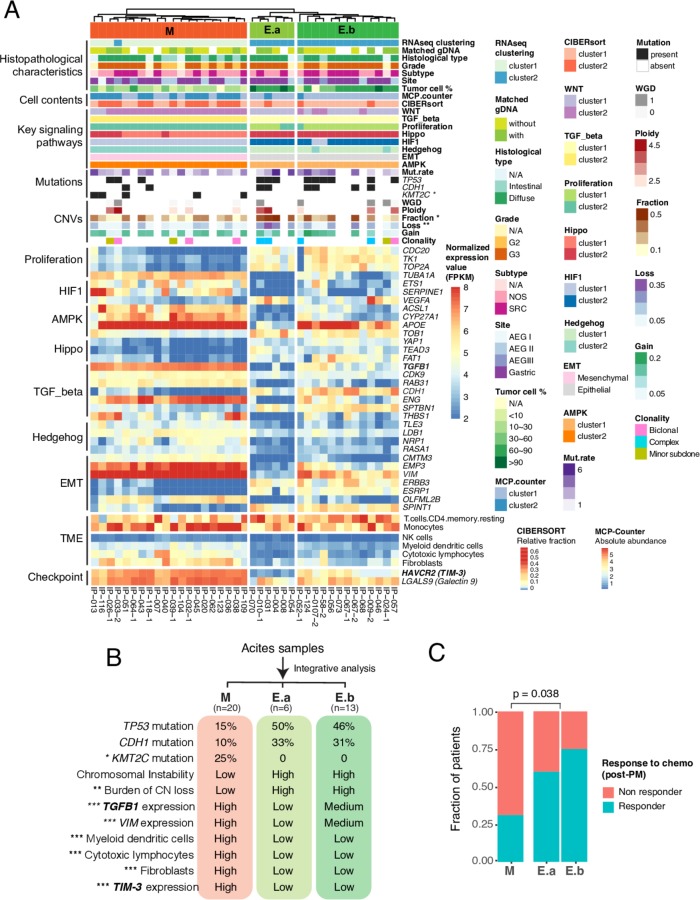
Figure 7.
Integrative clustering of clinical, genomic and expression features of peritoneal carcinomatosis (PC) specimens defines three molecular phenotypes that correlated with post-PC chemotherapy response. (A) Heatmap of histopathological and molecular features of three defined clusters. Top track: molecular phenotypes: M, ‘mesenchymal-like’ phenotype; E.a, ‘epithelial-like’ phenotype a; E.b, ‘epithelial-like’ phenotype b. Heatmap showing normalised expression values in FPKM for 32 most variable differentially expressed genes (DEGs) selected from 7 key signalling pathways. The asterisk indicates statistically significant difference between M and E phenotypes (*p<0.05; **p<0.01). Fisher’s exact test and non-parametric Mann-Whitney U test were used to calculate p values. (B) Genomic and molecular characteristics of three molecular subgroups. CIN, chromosomal instability; CN, copy number; exp, expression. (C) Correlation of defined molecular phenotypes with post-PC chemotherapy response. Compared with the epithelial phenotypes (E.a and E.b), the mesenchymal phenotype is less likely respond to chemotherapy. P value was calculated by the non-parametric Mann-Whitney U test. Chemo, chemotherapy.

