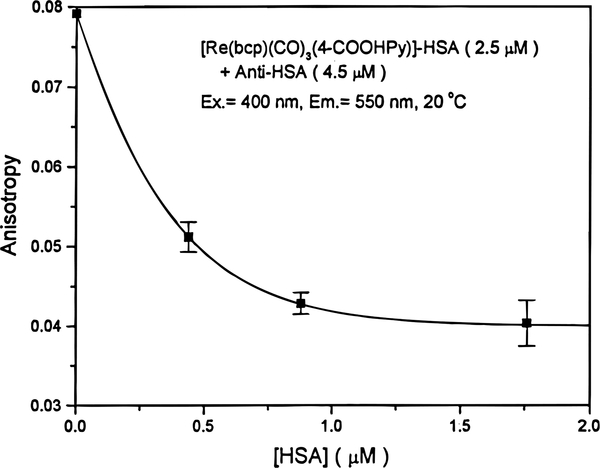
Figure 7.
Steady-state fluorescence anisotropy of Re–HSA added to preincubated mixtures of anti-HSA with various concentrations of unlabeled HSA measured at 20 °C. The excitation and observation wavelengths were 400 and 550 nm, respectively, with a bandpass of 8 nm. Error bars represent the standard deviations of three anisotropy readings.

