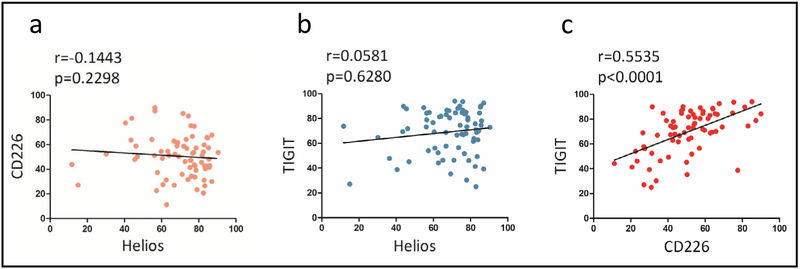
Fig. 6.
The correlation among different Treg related molecules in RA Tregs. (a) The expression of Helios in Tregs was not correlated with CD226 expression on Treg (p>0.05). (b) The expression of Helios in Tregs was not associated with TIGIT expression on Treg (p>0.05). (c) A linear association between CD226 expression and TIGIT expression was detected (r=0.5535, p<0.0001, n=74). Correlation analyses were carried out using Spearman’s rank correlation test.

