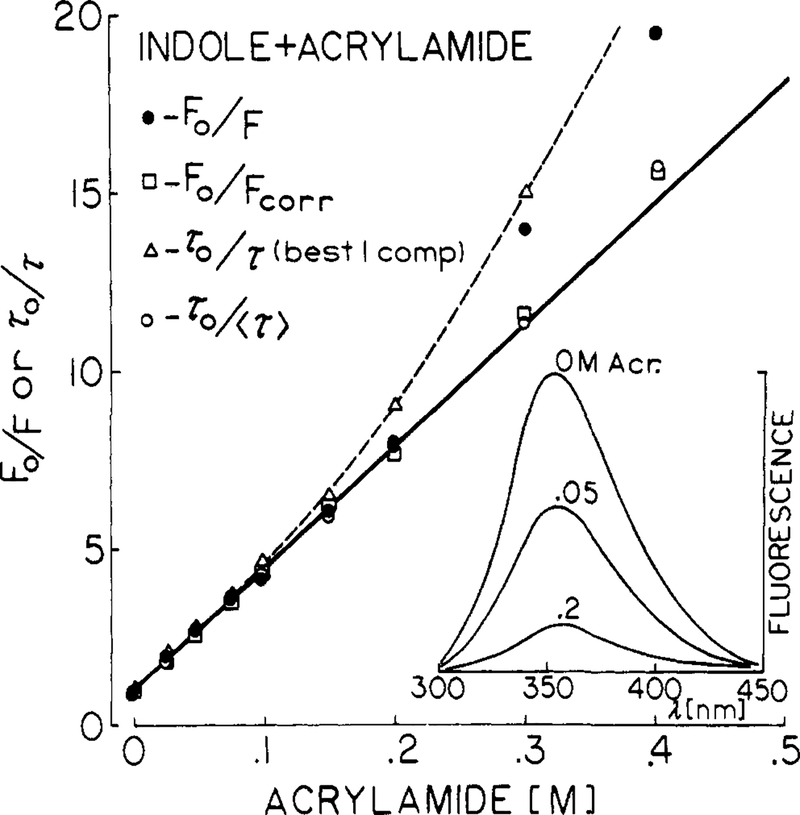
Figure 3.
Quenching of indole fluorescence by acrylamide, 20 °C. Stern-Volmer plots are shown for the uncorrected yields (●), the yields corrected for light absorption by acrylamide (□), the best single decay time (△), and the mean decay time (○) defined by f1τ1 + f2τ2 (Table III).

