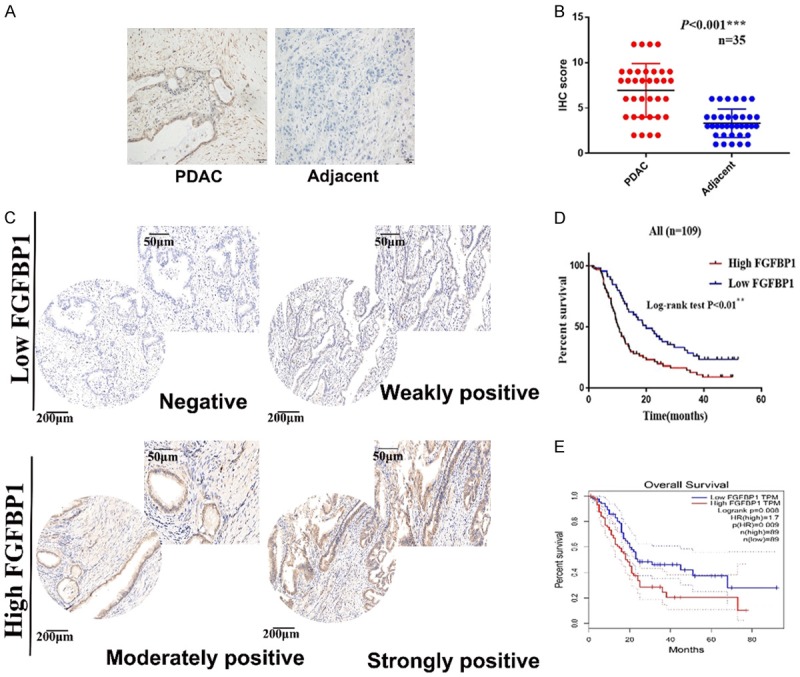
Figure 1.

FGFBP1 expression is increased in PDAC tissues. A. Representative images of IHC staining for FGFBP1 in PDAC and adjacent normal tissue (scale bar, 50 μm). B. FGFBP1 expression in PDAC and adjacent normal tissues, as determined by the IHC score (n=35, ***P<0.001). C. Representative images of IHC staining for FGFBP1 in tissue microarrays (scale bar, 200 µm; inset scale bar, 50 µm). D. The overall survival of patients with PDAC was analyzed using the Kaplan-Meier analysis on the basis of FGFBP1 expression in the tissues from our center (n=109, **P<0.01). E. The overall survival of patients with PDAC was analyzed using the Kaplan-Meier analysis on the basis of FGFBP1 expression in the tissues from GEPIA (n=178, **P=0.008).
