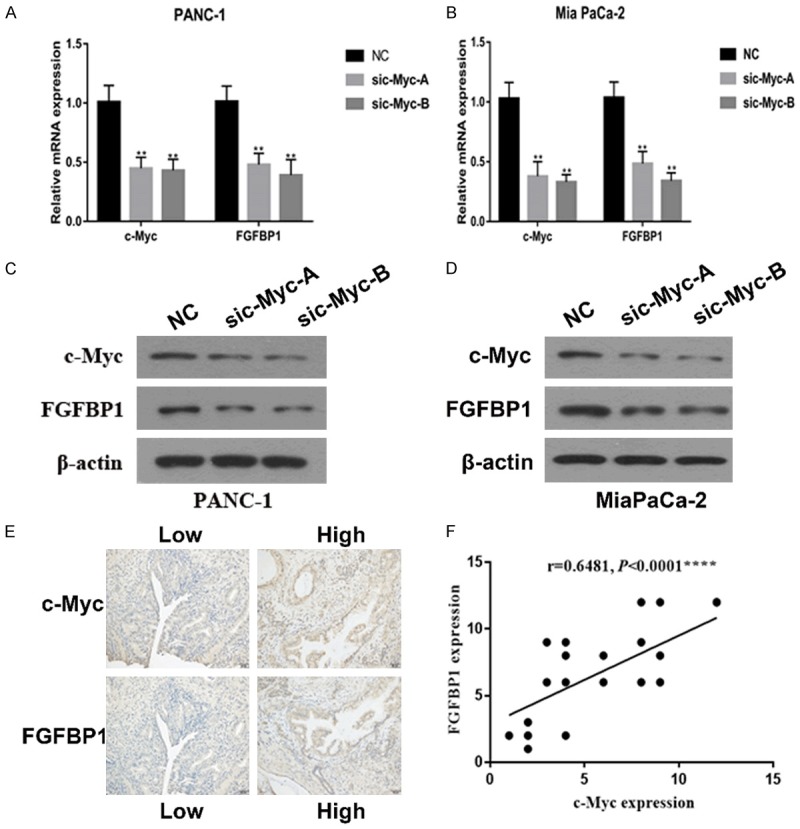
Figure 4.

Correlation between the expression of FGFBP1 and c-Myc. A, B. The mRNA levels of FGFBP1 in pancreatic cancer cell lines were measured by real-time PCR. C, D. The protein levels of FGFBP1 were analyzed by Western blotting following treatment. E. Representative images of IHC staining for FGFBP1 and c-Myc in PDAC tissues (scale bar, 50 μm). F. Correlation analysis of FGFBP1 expression and c-Myc expression in PDAC tissues, as determined by the IHC score (n=30 ****P<0.0001).
