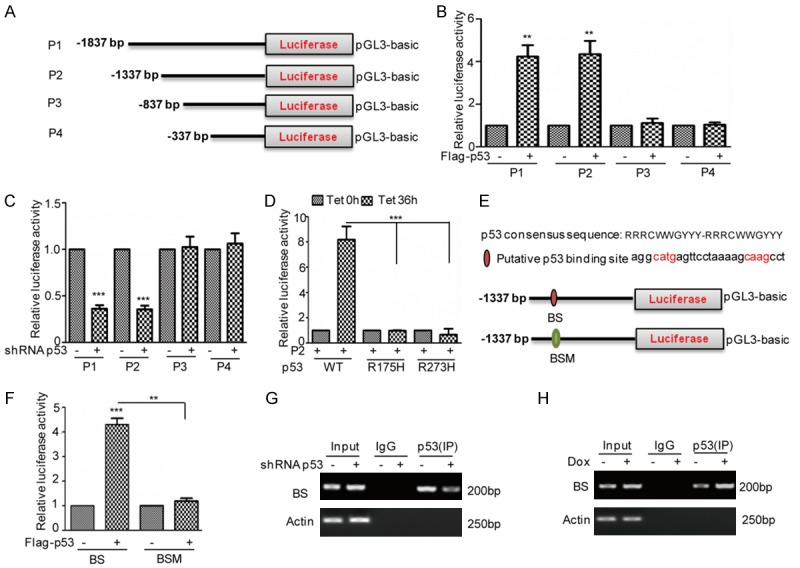
Figure 4.

p53 binds to the promoter of miR-3196. (A) Schematic illustration of pGL3-based reported constructs that were used in luciferase assays to examine the transcriptional activity of miR-3196. (B) The promoters of miR-3196, named P1, P2, P3, and P4, were individually transfected into 293T cells with or without p53 overexpression. The luciferase activity was measured. The data represent the means ± SD of three independent experiments; **P<0.01 vs. control. (C) The promoters of miR-3196, named P1, P2, P3, and P4, were individually transfected into HepG2 cells with or without p53 knockdown. The luciferase activity was measured. The data represent the means ± SD of three independent experiments; ***P<0.001 vs. control. (D) P2 was transfected into BEL7402 cells with or without p53 or mutants expression. The luciferase activity was measured. The data represent the means ± SD of three independent experiments; ***P<0.001 vs. control. (E, F) A schematic illustration of p53 wild type binding site (WT) and the matching mutant (Mut) that were used in the luciferase assays is shown. p53 wild type binding site (BS) and the matching mutant (BSM) were individually transfected into 293T cells with or without p53 overexpression. The luciferase activity was measured. The data represent the means ± SD of three independent experiments; **P<0.01, ***P<0.001 vs. control. (G, H) ChIP analysis showed the binding of p53 to the promoter of miR-3196 in HepG2 cells with p53 knockdown (G) or 2 μM Dox treatment (H). An isotype-matched IgG was used as a negative control.
