
Figure 3.
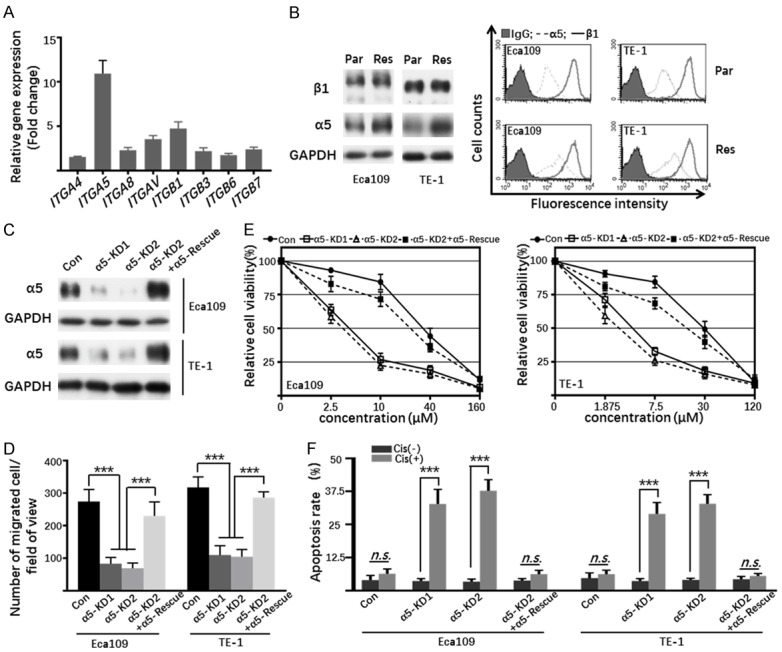
The effect of upregulated α5 on the sensitivity of chemotherapy in Res cells. A. The mRNA levels of ITGA4, ITGA5, ITGA8, ITGAV, ITGB1, ITGB3, ITGB6 and ITGB7 in Eca109-Par and Res cells were determined by qPCR. The columns represented the fold increase of mRNA in Res cells as compared to Par cells. The quantitative data were obtained from three independent experiments. B. Cell lysates from indicated cells were immunoblotted by anti-β1 and anti-α5 antibodies, GAPDH was used as a loading control (left panel). Indicated cells were collected and incubated with anti-β1 (bold line) and anti-α5 (dotted line) or with anti-IgG antibody (grey shadow), followed by incubation with Alexa Fluor 647 goat anti-mouse IgG subjected to FACS analysis (right panel). C. Cell lysates from Con, α5-KD1, α5-KD2, α5-KD2+α5-Rescue Eca109 and TE-1 Res cells were immunoblotted with anti-α5 antibody, GAPDH was used as a loading control. D. The migration of indicated cells treated with or without cisplatin was determined by transwell assay. Representative photos were taken and then the migrated cells were counted. The quantitative data were obtained from three independent experiments (***, P < 0.001, by two-tail unpaired t-test). E. The viability curve of Con, α5-KD1, α5-KD2, α5-KD2+α5-Rescue Eca109 (left panel), and TE-1 (right panel) Res cells under different concentrations of cisplatin treatment. Data were represented as the means ± standard derivation (n=3). F. The apoptosis of Con, α5-KD1, α5-KD2, α5-KD2+α5-Rescue Eca109 and TE-1 Res cells treated with or without cisplatin for 48 h were detected by FACS analysis through AnnexinV-FITC/PI staining. The percentages of apoptotic cells were statistically analyzed as the means ± standard derivation of three independent experiments (n.s., P > 0.05; ***, P < 0.001, by two-tail unpaired t-test).