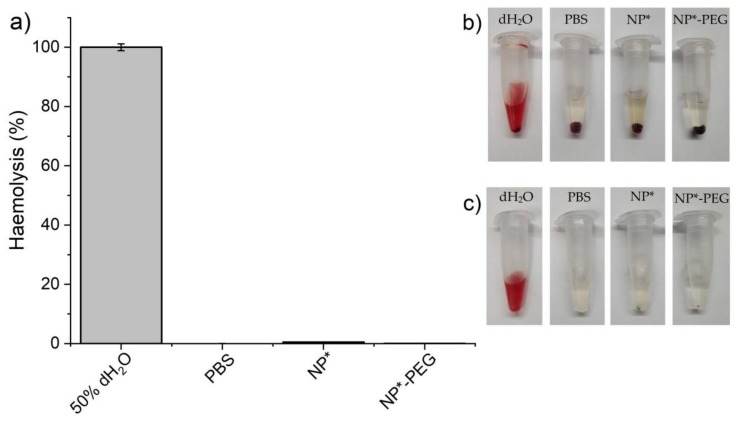
Figure 12.
In vitro hemolysis test results for diluted human blood exposed to NPs. (a) Hemolysis (%) after 4 h incubation. Values represent mean ± SD from experiments performed in triplicate. (b) Image of the microtubes after centrifugation (800× g for 15 min). (c) Image of the microtubes after discarding the remaining nanoparticles by centrifugation (16,000× g for 15 min) to avoid interference with absorbance measurements. NPs*: NPFe@FeOx@SiO2.

