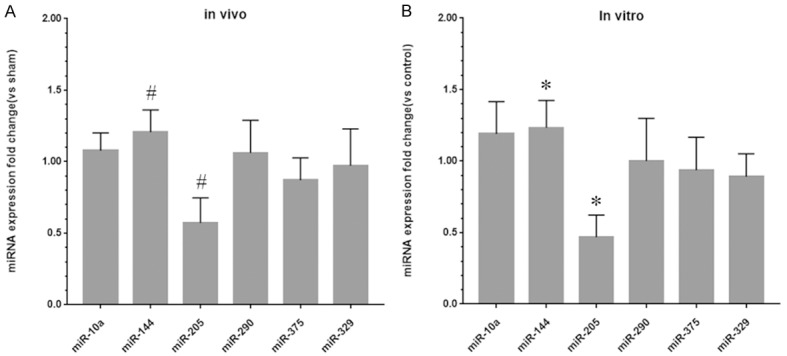
Figure 2.

miR-205 is significantly downregulated in IRI kidney tissues and HK-2 cells subjected to H/R treatment. A: Fold changes in the expression levels of miR-10a, miR-144, miR-205, miR-290, miR-375 and miR-329 in the IRI group compared to the sham group. B: Fold changes in the expression levels of miR-10a, miR-144, miR-205, miR-290, miR-375 and miR-329 in the H/R group compared to the control group. The data are expressed as the mean ± SD. #P < 0.05 versus the sham group, *P < 0.05 versus the control group.
