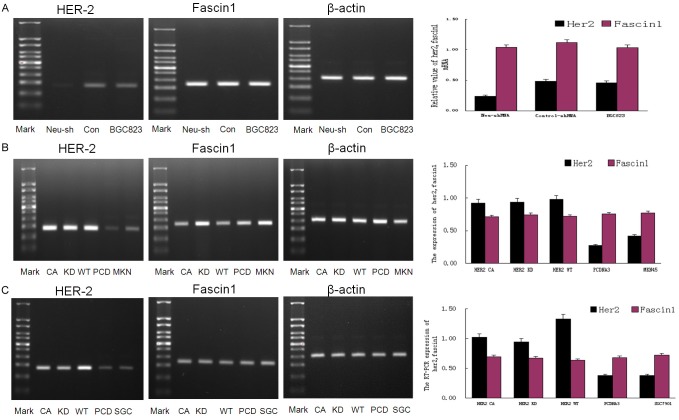
Figure 4.
RT-PCR analysis of HER-2 and Fascin1 expression in BGC823 (A), MKN45(B) and SGC7901 cells (C). (A) Compared with control-shRNA-BGC823 and BGC823 cells, the RNA expression of HER2 was decreased in neu-shRNA-BGC823 cells. There was no significant difference considering the expression of Fascin 1 among groups. (B) Compared with PCDNA3-MKN45 and MKN45 cells, the expression of HER2 was increased in HER2(CA)-MKN45, HER2(KD)-MKN45 and HER2(WT)-MKN45 cells. There was no significant difference considering the expression of Fascin 1 among groups. (C) The RT-PCR results of SGC7901 reached the same conclusion with MKN45.

