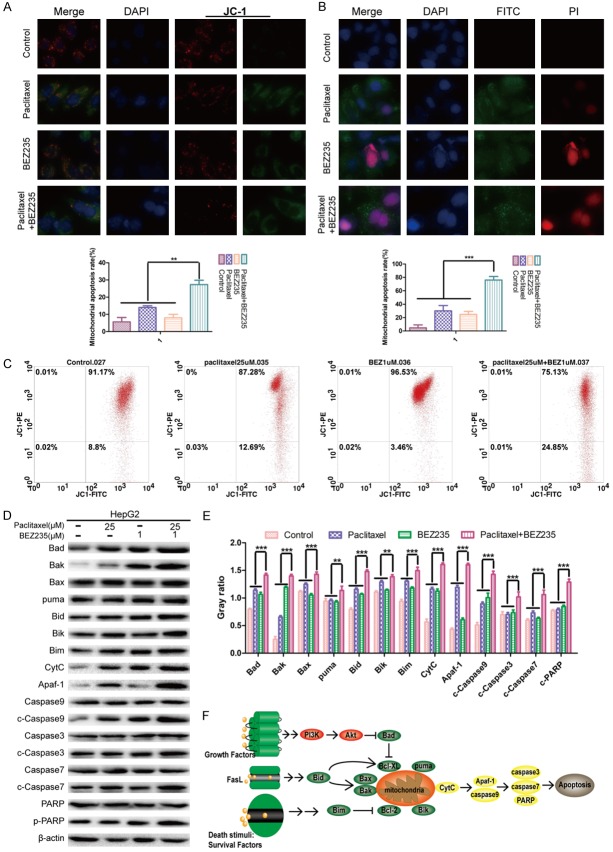
Figure 5.
Effects of BEZ235-PTX on apoptosis of HepG2 cells. A. HepG2 cells were treated with each treatment group for 24 h, then counterstained with JC-1 and DAPI and observed with fluorescence microscopy. ×400 magnification. B. HepG2 cells were treated with each treatment group for 24 h, counterstained with DAPI/Annexin V-FITC/PI and observed with fluorescence microscopy. ×400 magnification. C. HepG2 cells were treated with each treatment group for 24 h, the ΔΨm were dectected by flow cytometry. D. The expression levels of mitochondria-associated pro-apoptotic proteins (Bad, Bax, Bak, Bim, Bid, Bik, puma) and caspase proteins (caspase-9, -3, -7) in each treatment group were analyzed by WB. E. Statistical graph of the ratio of apoptosis-related proteins to β-actin. F. Related apoptotic molecule regulation pattern chart. Treatment groups: control; paclitaxel: 25 µM; BEZ235: 1 µM; paclitaxel + BEZ235: 25 µM + 1 µM. Data expressed as mean ± SD, n=3 (*P<0.05; **P<0.01; ***P<0.001).

