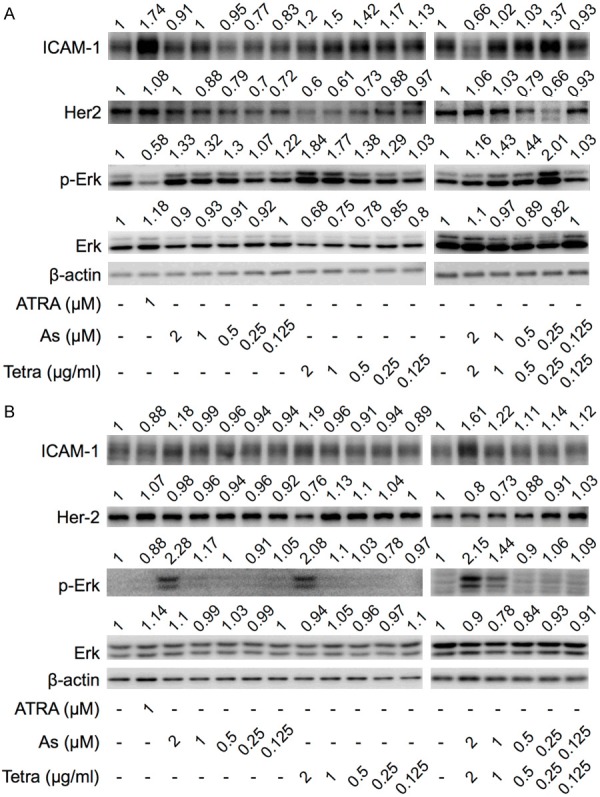
Figure 2.

Expression profile of differentiation-related proteins in breast cancer cells treated with AsIII and Tetra, alone or in combination. After treatment with indicated concentrations of AsIII and Tetra, alone or in combination, for 96 h, the expression profiles of differentiation-related proteins in MDA-MB-231 cells (A) and MCF-7 cells (B) were analyzed using western blot as described in material and methods. Representative image of the expression profile of each protein is shown from three independent experiments. The densitometry of protein bands was analyzed using a program, NIH ImageJ 1.52a. The values above each image represent the ratios between each key molecule and β-actin protein expression levels, which were further compared with those of control group (untreated cells). p-Erk, phosphorylated Erk; As, AsIII; Tetra, tetrandrine; ATRA, all-trans retinoic acid. ATRA (1 µM) used as a positive control for differentiation.
