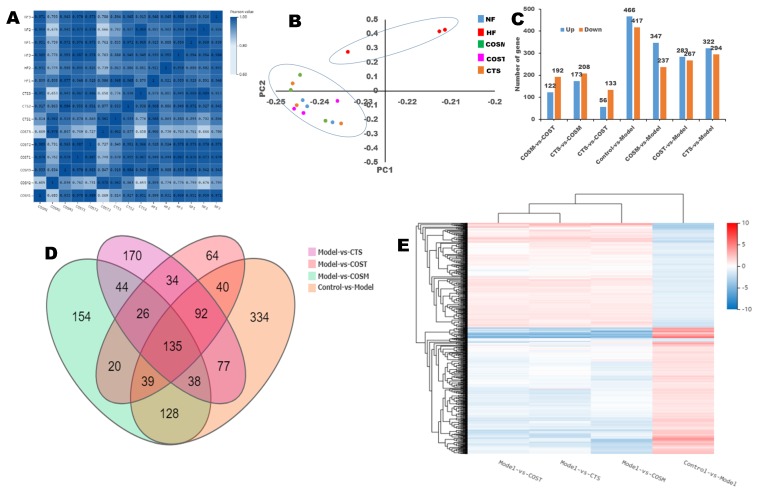
Figure 4.
Digital gene expression profiling (DGE) analysis. (A) The sample correlation heat map (n = 3 per group), (B) principal components analysis (PCA), (C) histogram of up- and down-regulated genes, (D) Venn diagram of DEGs. Graph of the quantity of DEGs (fold change ≥ 2 and adjusted P value ≥ 0.001), (E) clustering heat map of DEGs.

