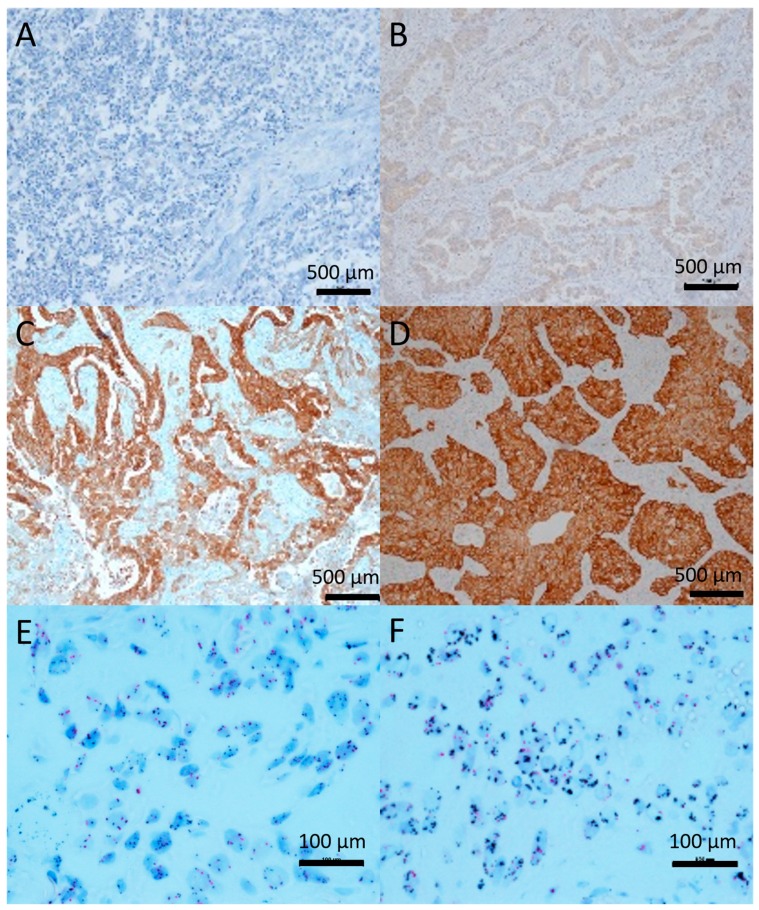
Figure 3.
Representative images of c-MET-IHC (SP44) and c-MET CISH (MET DNP/CEN7 DIG). Images A–D are at 400× magnification. Images E-F are on 600× magnification. (A) tumor with no c-MET expression (0). (B) tumor with low expression (1+). (C) tumor with moderate (2+) expression, showing a very heterogeneous staining. (D) tumor with high (3+) expression. (E) tumor showing low c-MET amplification, ratio c-MET/centromere 7 is 2. (F) tumor showing high c-MET amplification with c-MET gene foci present, ratio: 4.54. Scale bar = 1000 µm.

