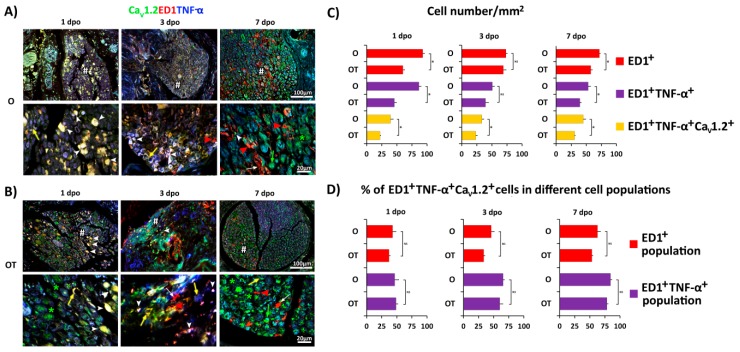
Figure 4.
Treatment with vitamin B complex induces time-dependent changes of CaV1.2 channel expression in M1 macrophages after PNI. To evaluate cellular distribution of the CaV1.2 isoform of l-VDCCs (green), cross sections of femoral nerve obtained from the: (A) operated (O); and (B) operated and treated with vitamin B complex (OT) groups were counterstained with anti-TNF-α (M1 marker, blue) and anti-ED1 (red) antibodies. The quantification of single-, double-, and triple-positive cells is presented as number of ED1+ cells/mm2, ED1+/TNF-α+ cells/mm2, and ED1+/TNF-α+/CaV1.2+ cells/mm2 (C), and as the percentage of triple -positive cells (ED1+/TNF-α+/CaV1.2+ cells) in ED1+ and ED1+/TNF-α+ cell populations (D). The data are shown as the mean ± SEM of three independent experiments (three images/group/independent experiment were captured). Statistical analysis was performed using a two-sided Student’s t-test (* p < 0.05 OT vs. O group, as indicated at the graphs). Intensive CaV1.2 staining, besides in M1 macrophages, was observed in axons (green asterisks) and in some ED1− cells (yellow and green arrows) as well. ED1+/CaV1.2+/TNF-α+ M1 macrophages are marked with a white arrowhead, ED1+ macrophages with oval/round morphology (M1 type) are marked with a red arrowhead, and “foamy” ED1+ macrophages (M2) are indicated with white arrows. # indicates where the high magnification micrographs are taken from. Scale bars: 20 µm and 100 µm. PNI: peripheral nerve injury; TNF: tumor necrosis factor.

