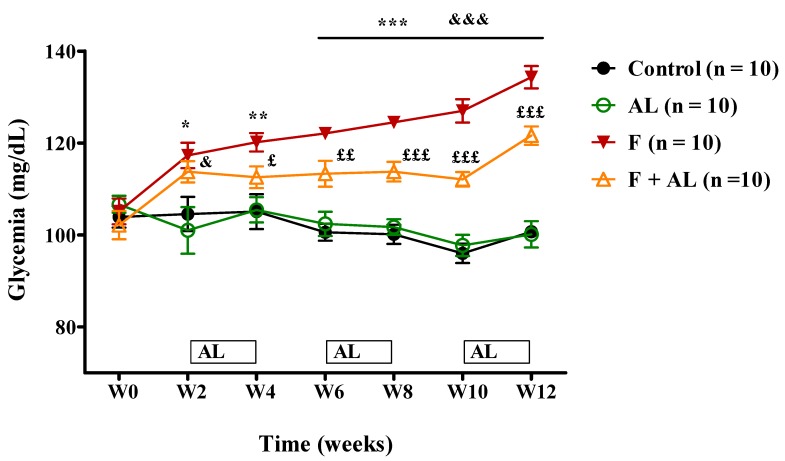
Figure 3.
Evolution of the glycemia, assessed over the 12 weeks of the study in the Control group (C), the alpha-lipoic acid-treated group (AL), the fructose-fed group (F), and the fructose-fed group treated with alpha-lipoic acid (F + AL) (* p < 0.05, ** p < 0.01, *** p < 0.001: F vs. C and AL; & p < 0.05, &&& p < 0.001: F + AL vs. C and AL; £ p < 0.05, ££ p < 0.01, £££ p < 0.001: F + AL vs F).

