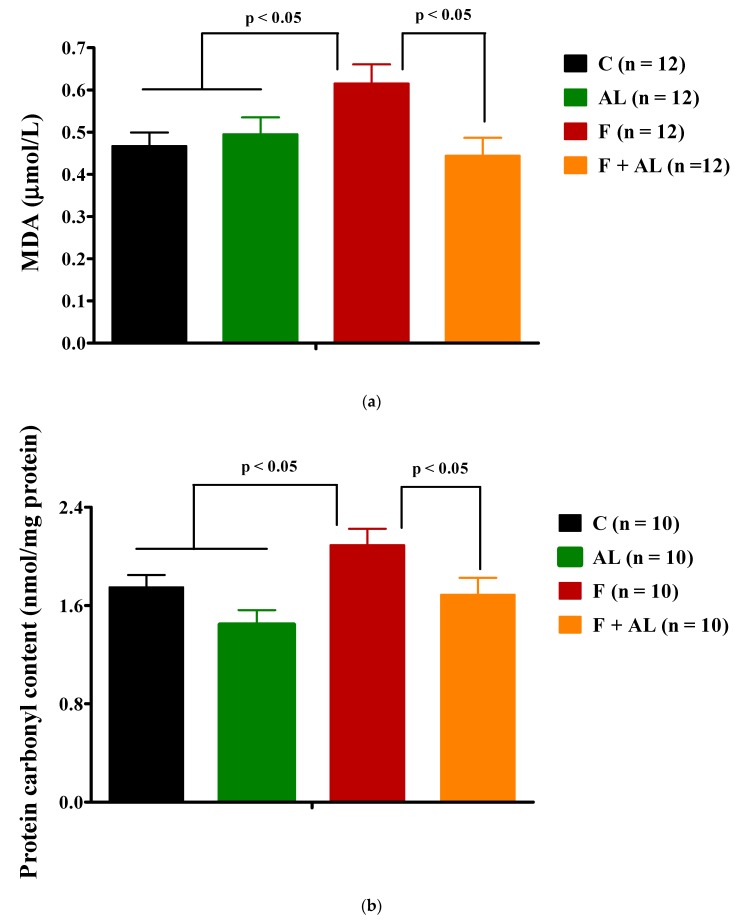
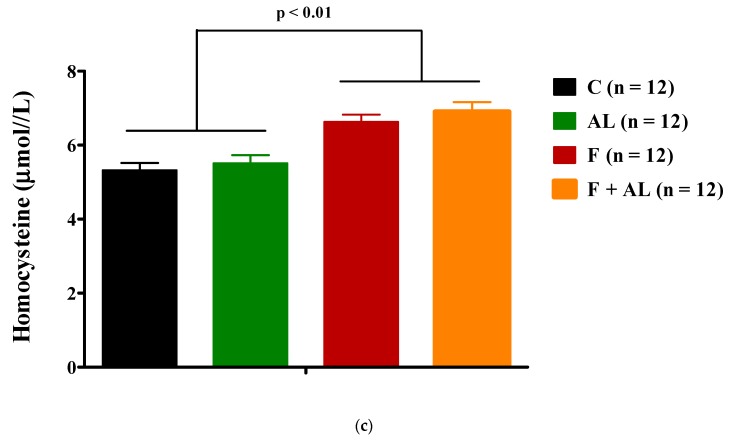
Figure 5.
Oxidative stress markers (a) Plasma lipid peroxidation expressed as Malondialdehyde (MDA); (b) Plasma protein oxidation expressed as protein carbonyl content; (c) Homocysteine level, determined 12 weeks after diet and treatment in the control group (C), the alpha-lipoic acid-treated group (AL), the fructose-fed group (F), and the fructose-fed group treated with alpha-lipoic acid (F + AL).


