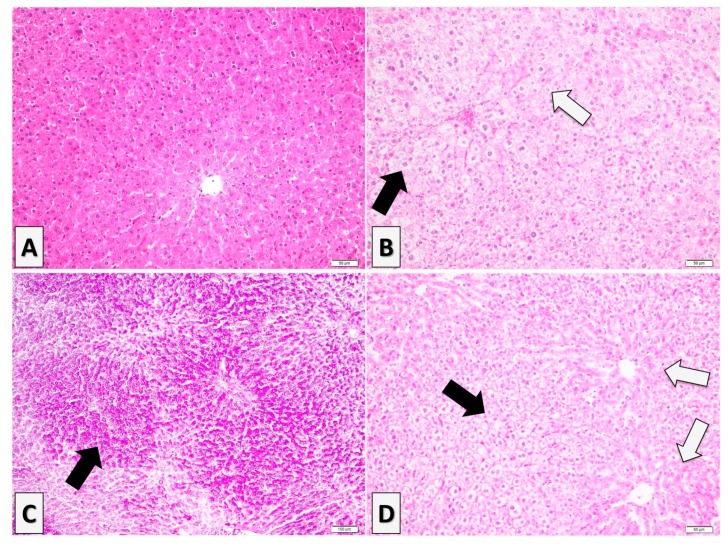
Figure 7.
Histological features of the liver in the experimental groups: (A) Control group—a normal histological aspect of the liver, H&E stain. (B) Fructose group—diffuse degenerative changes represented by a vacuolated aspect of the hepatocytes (black arrow) with karyopyknosis and nuclear fading (blank arrow), H&E stain. (C) Fructose group—intrahepatocytic vacuoles display a PAS-positive material suggesting glycogen accumulation (black arrow), PAS stain. (D) Fructose-fed group treated with alpha-lipoic acid (F + AL group)—perilobular location of the multivacuolated hepatocytes (black arrow), with no significant changes of the hepatocytes from the centrilobular and mediolobular zones (blank arrows).

