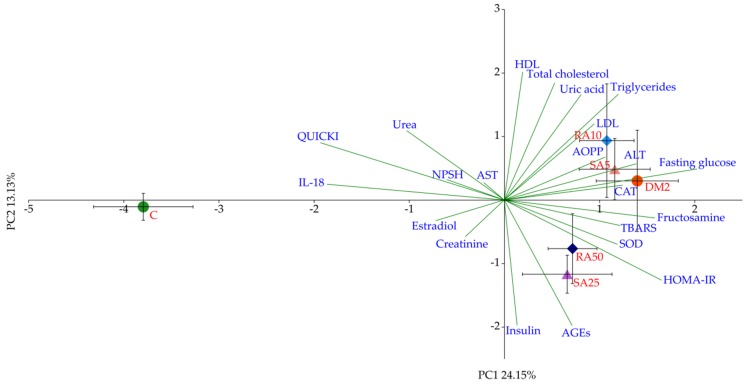
Figure 5.
Principal component analysis (PCA) biplot of parameters obtained from the serum. Symbols and red fonts indicate means for individual experimental groups (whiskers represent SEM). ●—Control groups: green—untreated control rats (C); red—HFD + STZ control rats (DM2). ◆—Rosmarinic acid-treated HFD + STZ rats: light blue—10 mg/kg (RA10), navy blue – 50 mg/kg (RA50). ▲—Sinapic acid-treated HFD + STZ rats: pink—5 mg/kg (SA5), purple—25 mg/kg (SA25). Blue fonts and green lines show correlations of measured parameters with regard to experimental groups in the PCA plot (autoscaled). AST: aspartate aminotransferase; IL-18: interleukin-18.

