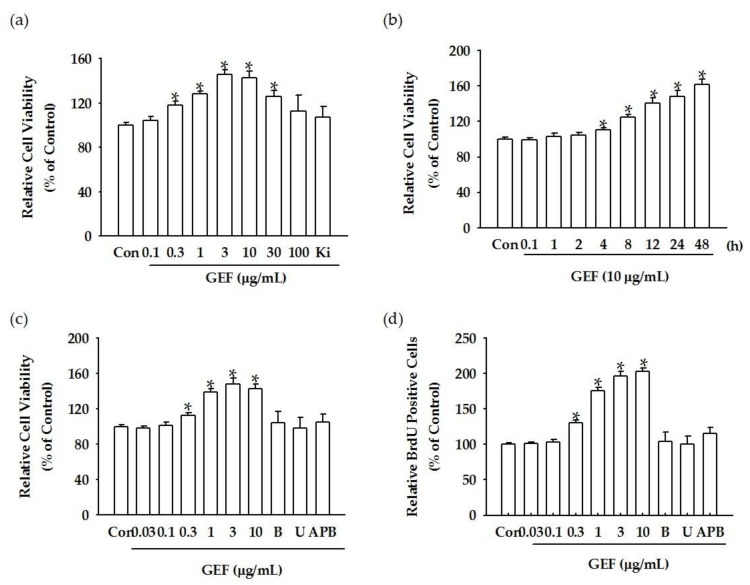
Figure 2.
Effects of GEF on cell viability and proliferation in HDFs. (a) A concentration-dependent cell viability assay under GEF and Ki16425 treatment. Cells were treated with the indicated concentration of GEF for 24 h. Histograms for viability of HDFs treated with 0.1–100 μg/mL GEF (* p < 0.05) compared to that of HDFs treated with DMSO-treated vehicle control. Human dermal fibroblast viability was estimated using the WST-1 assay. * p < 0.05, control vs. GEF (0.3, 1, 3, 10, and 30 μg/mL) or Ki16425 (10 μM) + GEF (3 μg/mL) treatment. The data are represented as the mean ± S.E.M. (n = 3). (b) Time-course treatment effect of GEF on cell viability. Histograms show the time course of relative cell viability following treatment with 10 μg/mL GEF (* p < 0.05) compared to the control (0 h). Data are represented as the mean ± S.E.M. (n = 3). (c) GEF-mediated HDF cell viability was blocked by BAPTA-AM, U73122, and 2-APB. B: GEF + BAPTA-AM (10 μM); U: GEF + U73122 (5 μM); APB: GEF + 2-APB (50 μM). Histograms show the time course of relative cell viability following treatment with 10 μg/mL GEF (* p < 0.05) compared to the control (0 h) (n = 3). (d) GEF-mediated HDF BrdU incorporation is blocked by BAPTA-AM, U73122, and 2-APB. B: GEF + BAPTA (10 μM); U: GEF + U73122 (5 μM); 2-APB: GEF + 2-APB (50 μM). Histograms show the time course of relative cell viability following treatment with 10 μg/mL GEF (n = 3) (* p < 0.05) compared to the control (0 h).

