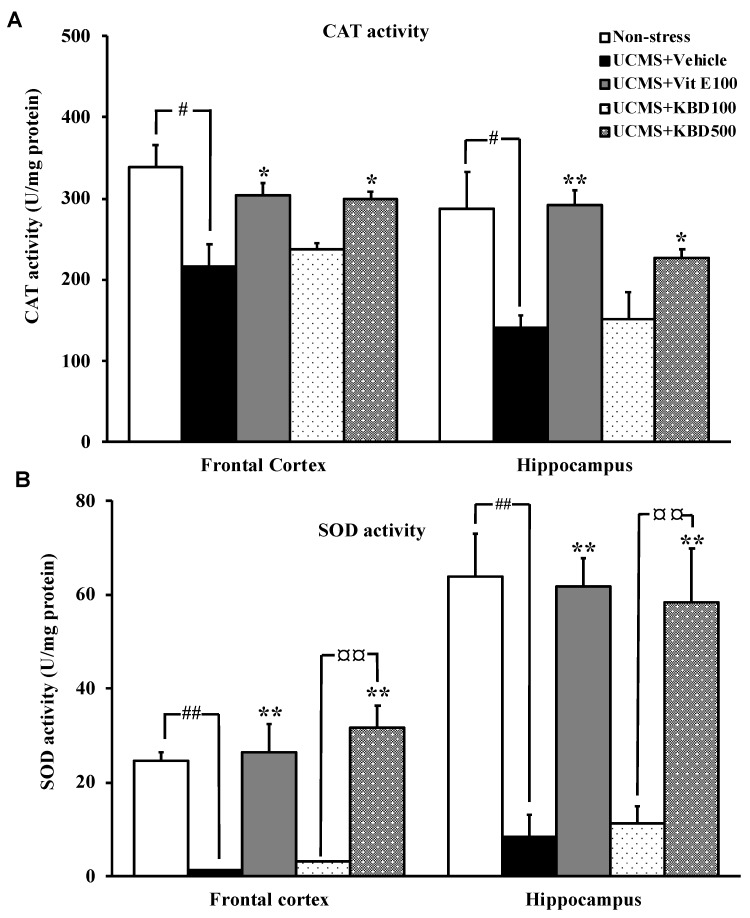
Figure 4.
The effect of KBD and vitamin E on the activities of the brain antioxidant enzymes in the UCMS mice (A: CAT activity, B: SOD activity). Each data column represents the mean ± S.E.M (n = 3–5). #p < 0.05 and ##p < 0.001 vs. the vehicle-treated non-stress group. * p < 0.05 and ** p < 0.001 vs. the vehicle-treated UCMS group. ¤¤ p < 0.001 compared between doses of KBD.

