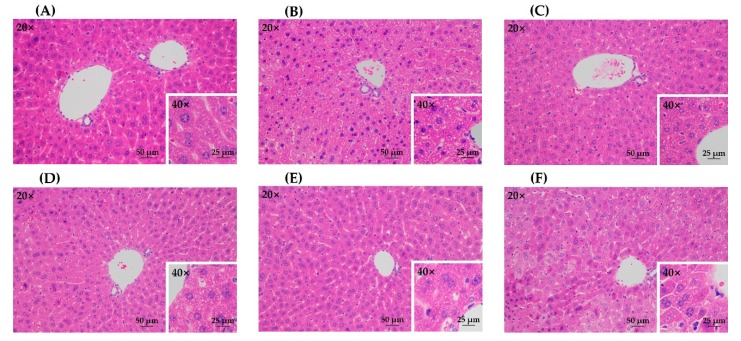
Figure 5.
The histopathological observation of hematoxylin and eosin (H&E)-stained liver tissue slices. (A) control group; (B) model group; (C) UST group (50 mg/kg body weight); (D) TAN group (50 mg/kg body weight); (E) US group (50 mg/kg body weight); (F) GTE group (50 mg/kg body weight). UST, the group treated with ultrasound and tannase; TAN, the group treated with only tannase; US, the group treated with only ultrasound; GTE, the group treated without ultrasound and tannase.

