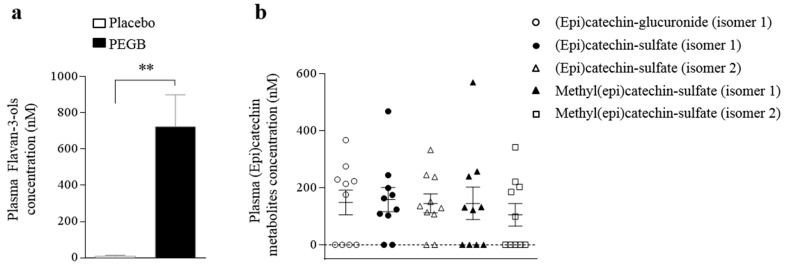
Figure 5.
Flavan-3-ols metabolites detected in human plasma samples (n = 10): (a) plasma concentration of total flavan-3-ols and their colonic metabolites detected 3.5 h after product ingestion; (b) individual plasma concentration of (epi)catechin conjugated metabolites detected. Data are expressed as mean ± SE. Significant statistical results for treatment effect from paired t-test are shown by (** p < 0.01).

