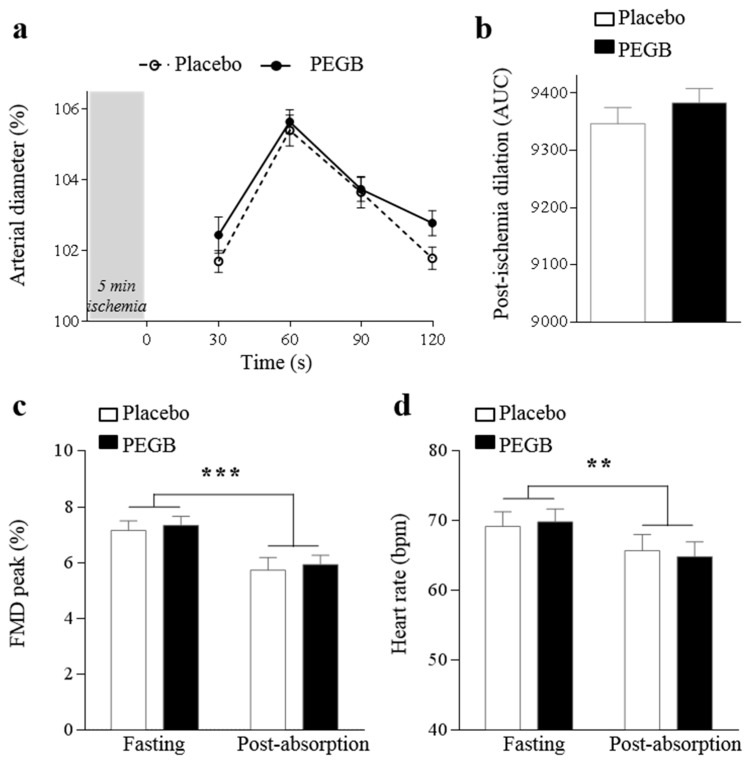
Figure 6.
Effect of time and treatment on flow mediated dilation and heart rate during visit: (a) percentage of post-ischemia arterial dilation from 30 s to 120 s; (b) area under the curve of post-ischemic total dilatation; (c) FMD peak; and (d) heart rate. Data are expressed as mean ± SE. Significant statistical results for time effect from linear-mixed models are shown by (** p < 0.01, *** p < 0.001). n = 26 for placebo and PEGB group.

