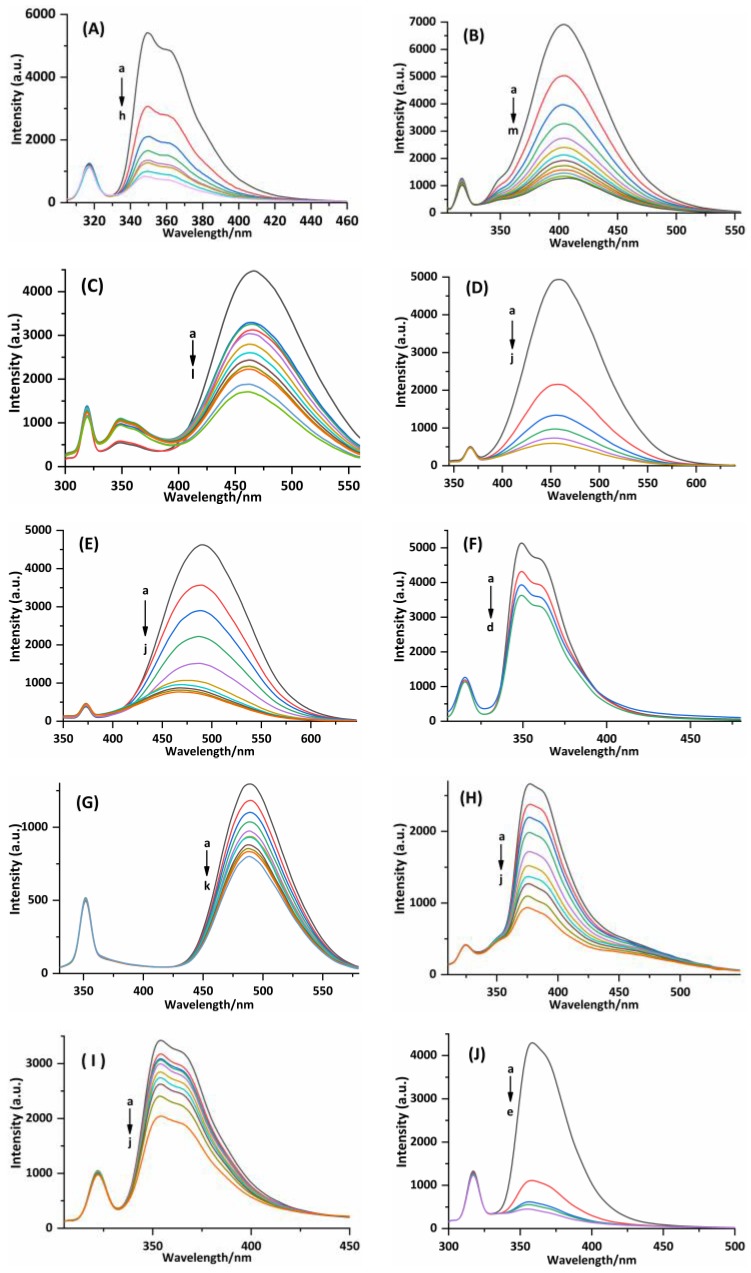
Figure 7.
Fluorescence spectra of compounds 1–10 in the absence or presence of CT-DNA in Tris-HCl buffer (pH 7.2). (A) Emission spectra excited at 285 nm, c(1) =100 µM and c(CT-DNA) = 0, 10, 20, 30, 40, 50, 60, and 70 µM corresponding to the curves from a to h, respectively. (B) Emission spectra excited at 313 nm, c(2) = 0.25 µM and c(CT-DNA) = 0, 8, 16, 24, 32, 40, 48, 56, 64, 72, 80, 88, and 96 µM corresponding to the curves from a to m, respectively. (C) Emission spectra excited at 287 nm, c(3) = 1 µM and c(CT-DNA) = 0, 8, 16, 24, 32, 40, 48, 56, 64, 80, 96, and 112 µM corresponding to the curves from a to l, respectively. (D) Emission spectra excited at 325 nm, c(4) = 0.5 µM and c(CT-DNA) = 0, 4, 8, 12, 16, and 20 µM corresponding to the curves from a to f, respectively. (E) Emission spectra excited at 330 nm, c(5) = 0.5 µM and c(CT-DNA) = 0, 2, 3, 4, 6, 8, 10, 12, 14, and 16 µM corresponding to the curves from a to j, respectively. (F) Emission spectra excited at 284 nm, c(6) = 10 µM and c(CT-DNA) = 0, 8, 16, and 24 µM corresponding to the curves from a to d, respectively. (G) Emission spectra excited at 313 nm, c(7) = 10 µM and c(CT-DNA) = 0, 8, 16, 24, 32, 40, 48, 56, 64, 80, and 96 µM corresponding to the curves from a to k, respectively. (H) Emission spectra excited at 289 nm, c(8) = 30 µM and c(CT-DNA) = 0, 1.8, 3.6, 5.4, 9, 12.6, 16.2, 19.8, 27, and 32 µM corresponding to the curves from a to j, respectively. (I) Emission spectra excited at 289 nm, c(9) = 0.5 µM and c(CT-DNA) = 0, 1.8, 3.6, 7.7, 12.6, 16.2, 22.4, 33, and 49 µM corresponding to the curves from a to j, respectively. (J) Emission spectra excited at 285 nm, c(10) = 0.5 µM and c(CT-DNA) = 0, 8, 16, 24, and 32 µM corresponding to the curves from a to e, respectively.

