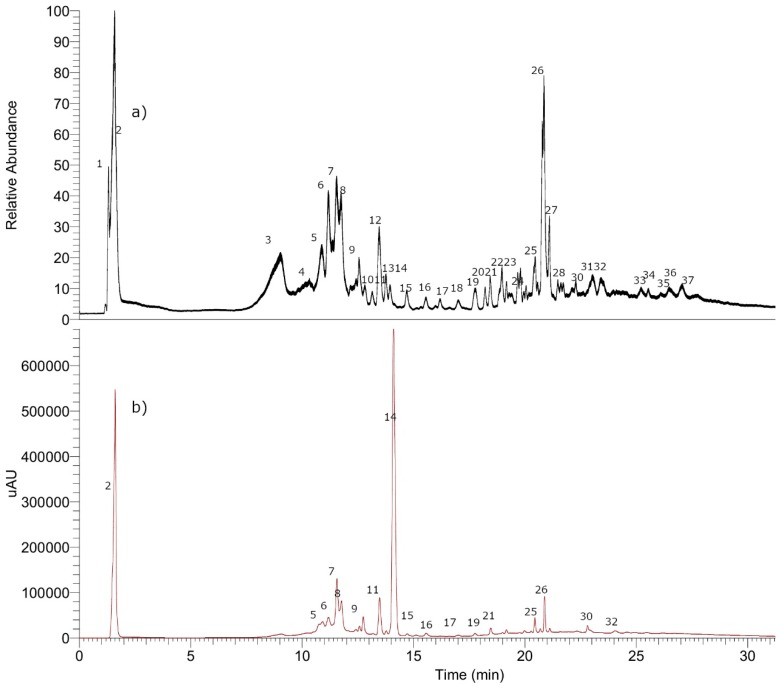
Figure 10.
UHPLC chromatograms: (a) (TIC) total ion current and (b) UV at 280 nm of P. quadrangularis (Pq). Numbers of the peaks represent the metabolites. The details of metabolites are depicted in the Table S1, Supplementary Materials, plus examples of full MS spectra in Figure S1.

