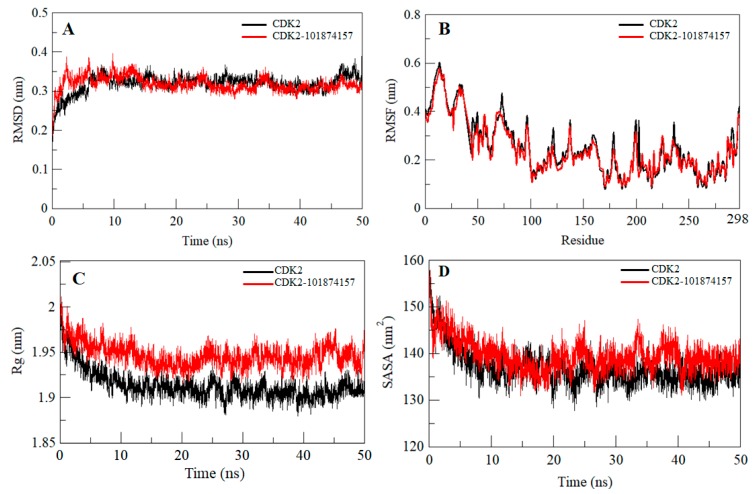
Figure 3.
Dynamics of CDK2 structure after binding of the compound 101874157. (A) Time evaluation of root-mean-square deviation (RMSD) of CDK2 and CDK2-101874157 complex. (B) Root-mean-square fluctuation (RMSF) of CDK2 before and after compound binding. (C) Time evolution of the radius of gyration. (D) Solvent accessible surface area (SASA) plot of CDK2 before and after compound binding. Values were obtained from the 50 ns molecular dynamics (MD) simulation time scale. Black and red represent free CDK2 and CDK2-101874157 complex, respectively.

