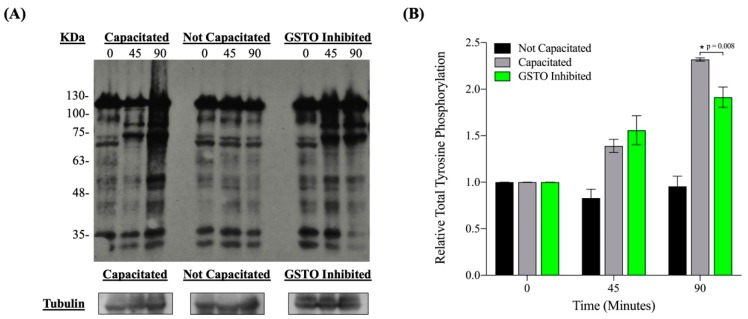
Figure 4.
The level of protein tyrosine phosphorylation during in vitro capacitation in mouse spermatozoa. (A) Total protein tyrosine phosphorylation patterns at 0, 45 and 90 min after in vitro capacitation in DMSO-treated and capacitated (Capacitated), DMSO-treated and not capacitated (Not Capacitated) and GSTO-inhibited and capacitated (GSTO Inhibited) mouse spermatozoa samples. (B) The intensity of the total protein tyrosine phosphorylation levels, shown in the Western blot at each time point for each treatment, were quantified using Image J and normalized to the respective intensity of alpha tubulin. Total tyrosine phosphorylation relative intensities were further normalized so that all time 0 values were 1. All measurements are the averages of three trials, all performed with different mice. Error bars represent standard error and * signifies statistical significance of p = 0.008 determined by a one-way ANOVA.

