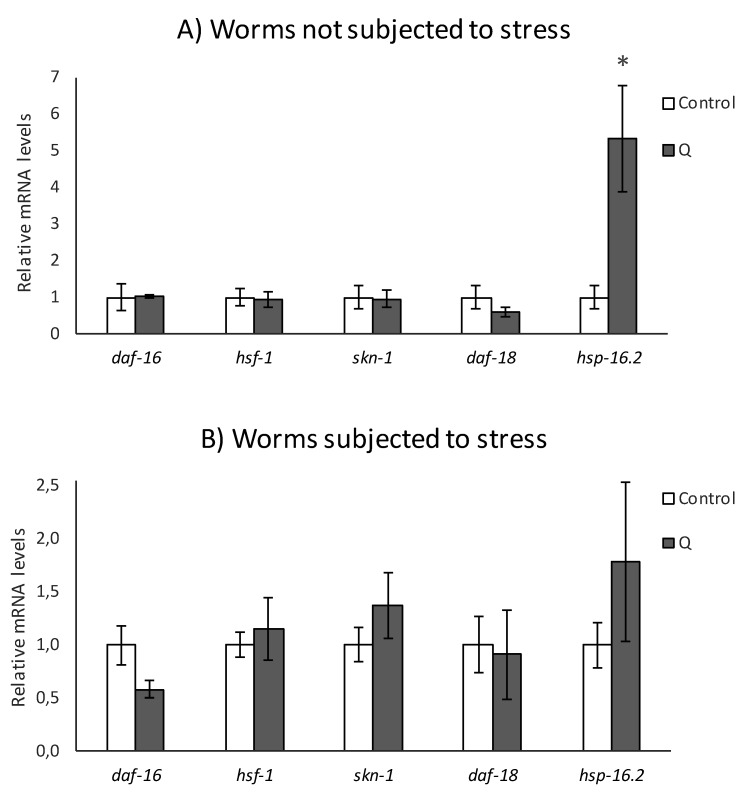
Figure 5.
Effect of Q on the expression of daf-16, hsf-1, skn-1, daf-18, and hsp-16.2 genes in N2 C. elegans cultivated in the absence (controls) and presence of Q (200 μM) (A) under non-stressed conditions or (B) after subjecting them to thermal stress. The expression level was determined by RT-qPCR. act-1 was used as housekeeping control. Nine independent experiments were performed. The results are presented as the mean values ± Standard Error of the Mean (SEM). Statistical significance was calculated using by one-way analysis of variance (ANOVA). The asterisk (*) indicates significant differences at p < 0.05.

