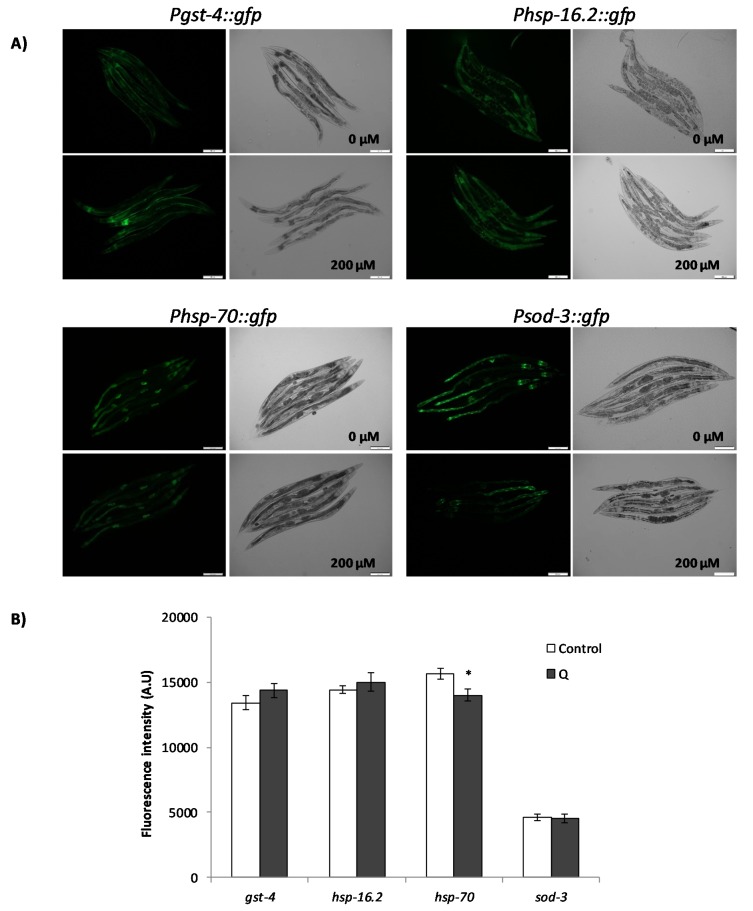
Figure 6.
Effect of Q on the expression of gst-4, hsp-16.2, hsp-70, and sod-3 after cultivation of C. elegans in the absence and presence of Q (200 μM). (A) Representative fluorescence images of control and Q-treated worm strains. (B) Quantification of the relative fluorescence intensities of transgenic worms. Total green fluorescent protein (GFP) fluorescence of each whole worm was quantified using Image J software. Three independent experiments were performed. The results are presented as the mean values ± SEM. Approximately 35 randomly selected worms from each set of experiments were examined. Differences compared with the control (0 μM Q, 0.1% dimethyl sulfoxide (DMSO)) were considered statistically significant at * (p < 0.05) by one-way ANOVA.

