Figure A1.

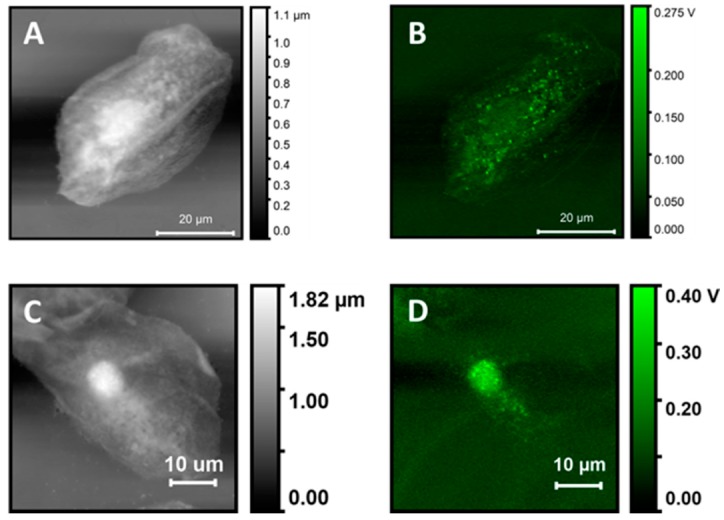
Comparison of AFM height and PTIR images for two different buccal cells. (A,C)—Height Maps. (B,D) PTIR maps at 1650 cm−1.

Comparison of AFM height and PTIR images for two different buccal cells. (A,C)—Height Maps. (B,D) PTIR maps at 1650 cm−1.