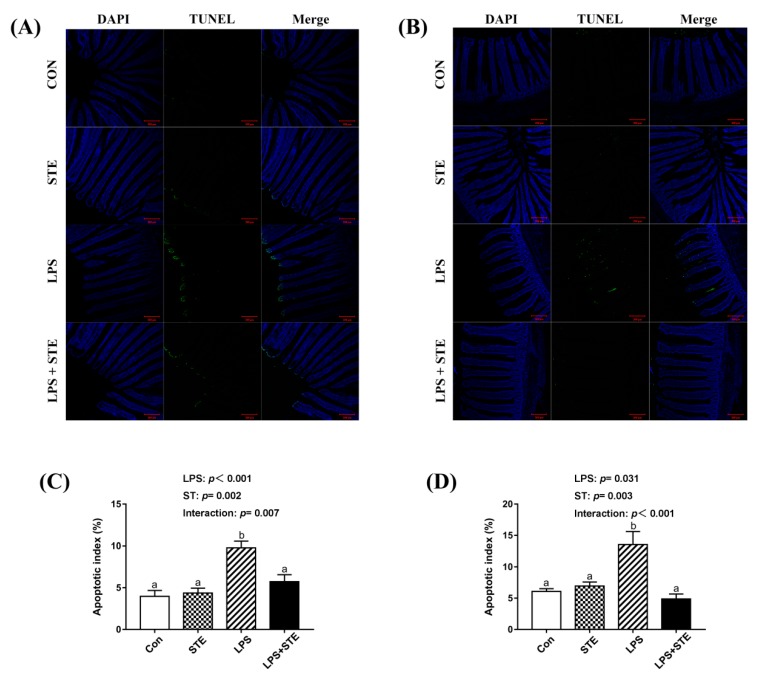
Figure 3.
TUNEL assay of jejunal (A) and ileal (B) sections of LPS-challenged broilers by immunofluorescence. The blue color represents the total cells, and the green color represents the apoptosis cells in the jejunum and ileum. (C) Statistical analysis of apoptotic index in the jejunum. (D) Statistical analysis of apoptotic index in the ileum. CON, non-challenged broilers fed a basal diet; STE, non-challenged broilers fed a basal diet supplemented with 250 mg/kg stevioside; LPS, LPS-challenged broilers fed a basal diet; LPS + STE, LPS-challenged broilers fed a basal diet supplemented with 250 mg/kg stevioside. Data are presented as mean value ± SEM (n = 6). a,b Means with different letters are significantly different (p < 0.05). Scale bar = 200 μm.

