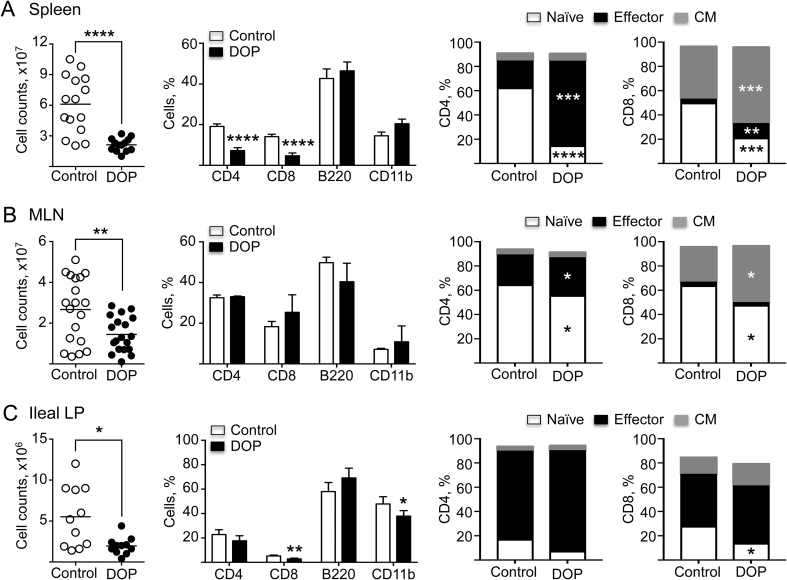
FIGURE 3.
Effects of DOP on cell subsets within immune compartments. Cell counts and subset flow cytometry analyses of (A) spleen, (B) MLNs, and (C) ileal LP of TNFΔARE mice treated with DOP or vehicle control for 2 weeks. Data are from 3 independent experiments, expressed as mean ± SEM; n ≥ 10 mice/group (*P < 0.05; **P < 0.01; ***P < 0.001; ****P < 0.0001 by 2-tailed t test).

