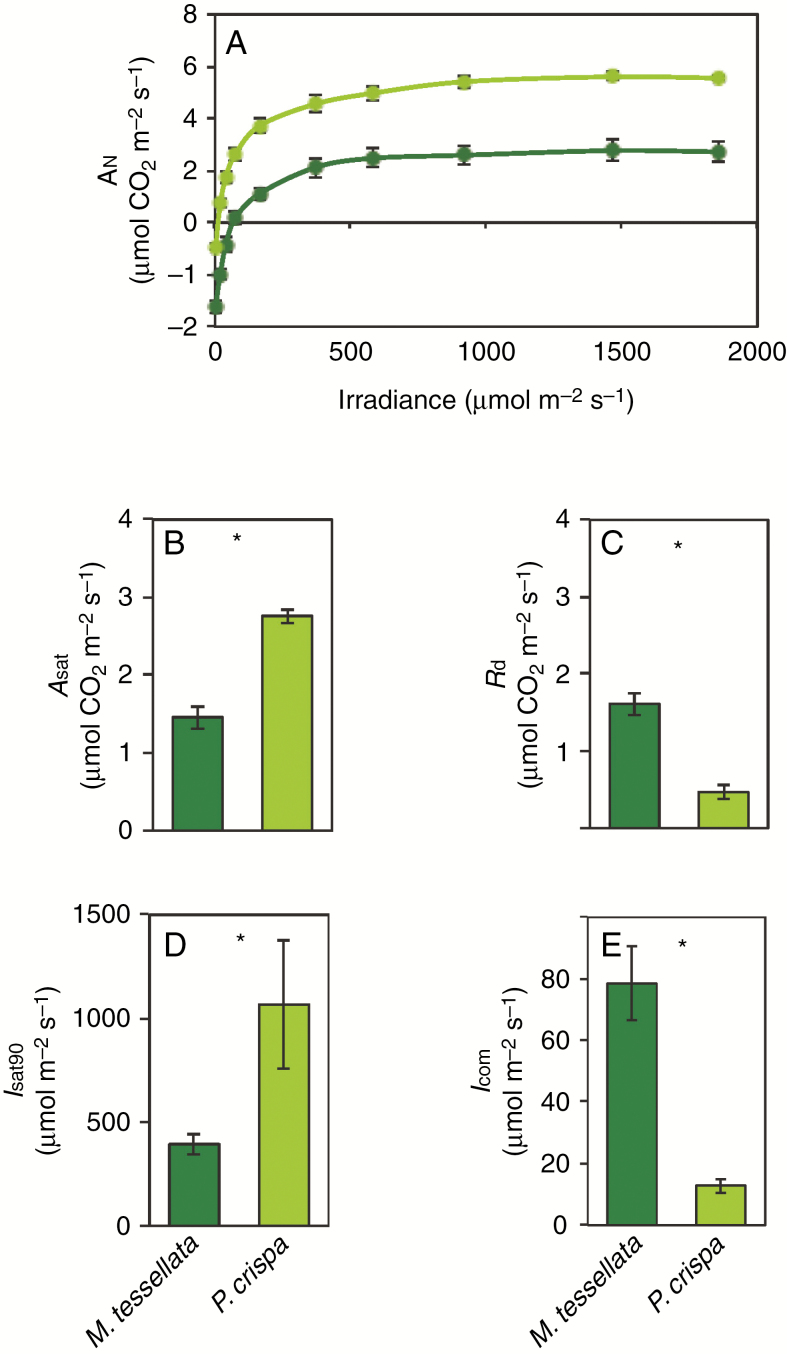
Fig. 4.
Gas exchange data for M. tessellata (dark green) and P. crispa (light green) measured at +20 ºC in hydrated samples in the laboratory of the BAE JCI. (A) Light curve of net CO2 assimilation expressed on a thallus area basis. (B), (C), (D) and (E) depict maximum net assimilation An (Asat), dark respiration (Rd), irradiance at which 90 % of Asat is achieved (Isat90) and light compensation point (Icom), respectively, calculated by Michaelis–Menten curve fitting. Data are mean ± s.e. (n = 4 or 5). Asterisks denote significantly different values (P < 0.05).

