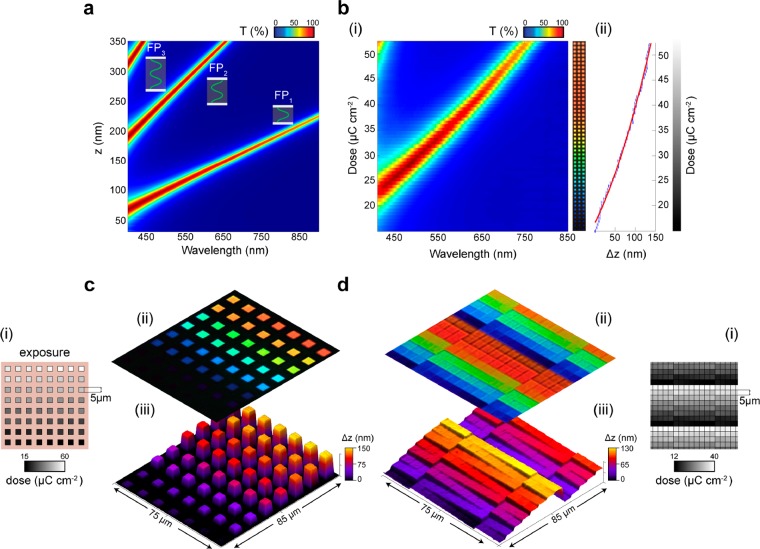
Figure 2.
Grayscale exposure dose to color: experimental verification. (a) Finite-difference time-domain (FDTD) simulations of the optical transmission from a continuous Ag-based MIM cavity as a function of varying insulator thickness, with geometry: SiO2(bulk)–Ag(26 nm)–resist (n = 1.653)–Ag(26 nm)–MgF2(12 nm). (b) Experimental demonstration of grayscale-to-dose pattern with the same layers as in (a): (i) Transmission spectra from dose-modulated 5 μm × 5 μm squares (optical micrograph shown in inset), which results in increasing thickness and hence varying peak wavelengths; (ii) measured curve, using an AFM, linking dose and thickness (standard deviation error bars in blue, with overlaid polynomial-fitted red line). Only the first-order resonance is present at low doses, but for higher doses (>50 μC cm–2), the second-order mode is also excited. (c) Dose-modulated 5 μm × 5 μm pixel array with 10 μm spacing: (i) dose-modulated pattern, (ii) optical micrograph, and (iii) corresponding AFM data. (d) Same as (c) but with zero dead space.

