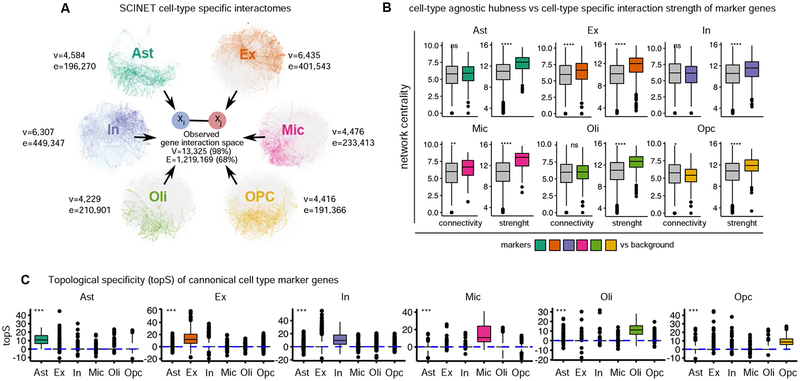
Figure 2. Patterns of specificity of identified interactions.
A, summary of inferred cell-type specific networks, v, vertices/nodes; e, edges B, patterns of connectivity and interaction strength computed within cell-type specific networks for canonical markers of each cell-type. Statistical test: two-sided Wilcoxon rank sum test. C, distribution of topological-specificity scores computed for each cell-type specific network for canonical transcriptional markers of a particular cell-type. Statistical test: Kruskal–Wallis one-way analysis of variance. Convention for symbols indicating statistical significance: ns: p > 0.05, *: p <= 0.05, **: p <= 0.01, ***: p <= 0.001, ****: p <= 0.0001. See also Figure S1.

