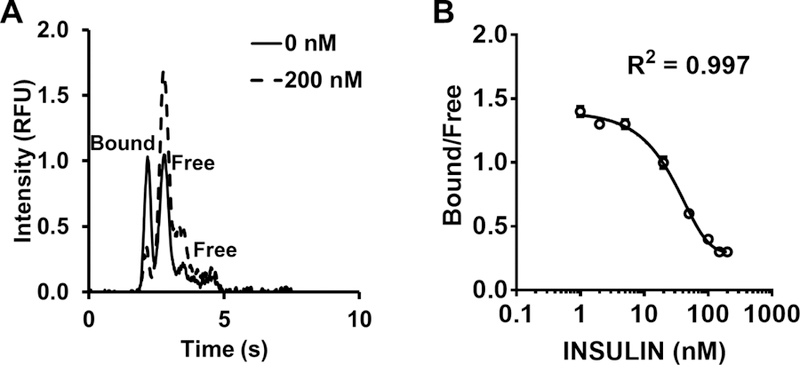
Figure 2.

Sample electropherograms and calibration curve. (A) Sample electropherograms at 0 nM and 200 nM insulin standards. Bound and free indicate Ab:Ag* complex and free Ag*, respectively. There are 2 free peaks because FITC-insulin are mono- and double-labeled. We use the first free peak area for B/F calculation. B/F is approximately one at 0 nM insulin. (B) A sample calibration curve. Error bars indicate ±1 standard deviation. The mean and standard deviation were calculated based on 10–15 electropherograms for each data point.
