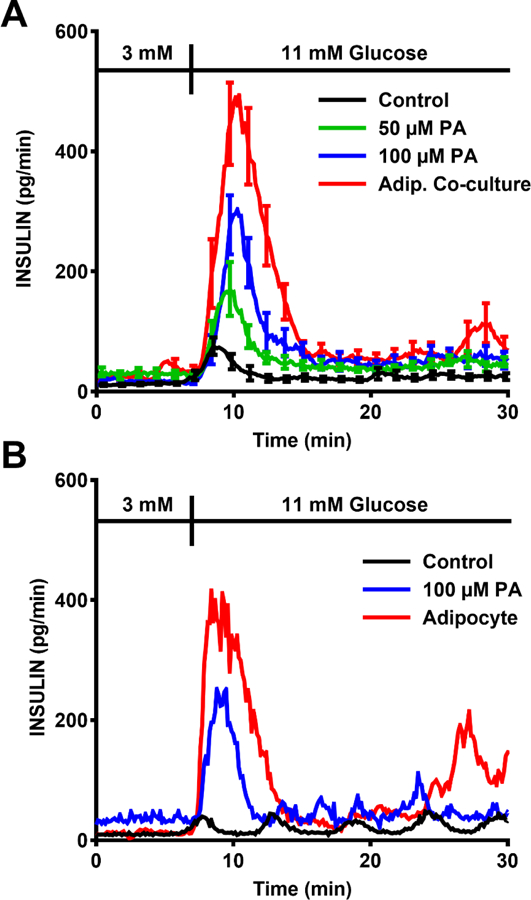
Figure 3.

Insulin secretion data is plotted by connecting the insulin concentration data collected every 8 s. (A) Summary of insulin secretion during a 3–11 mM glucose stimulation after 3 h pretreatment with 0 (control), 50 µM, or 100 µM palmitate (PA) compared to similar pretreatment with adipocytes. The error bars indicate ±SEM (n = 5–19 islets from a total of 3–5 mice for each condition). The error bars are shown only on every 10th point for clarity. (B) Representative insulin secretion from single islets for these experiments.
