
Figure 4.
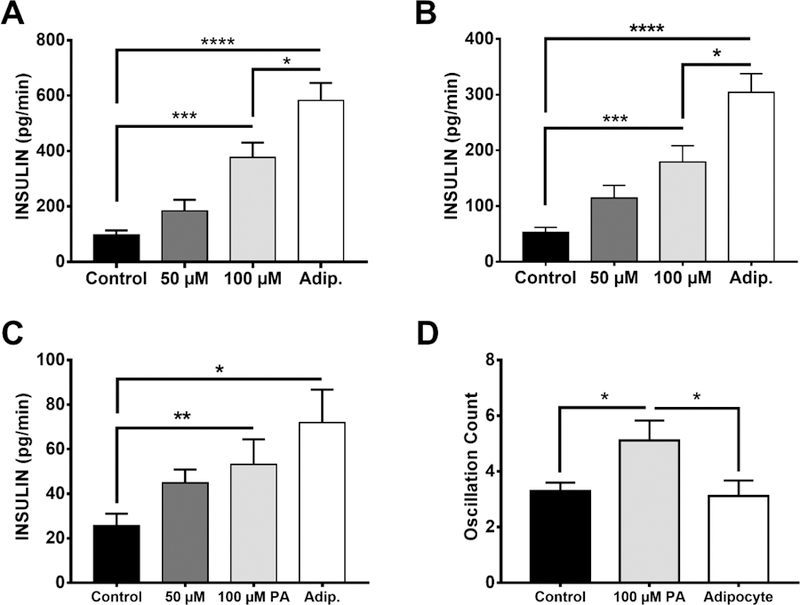
Statistical analysis of insulin secretion. (A) Peak insulin secretion rate, also indicated by the apex value of 1st phase insulin secretion in Figure 5A. (B) Average insulin secretion rate in 1st phase. (C) Average insulin secretion rate in 2nd phase. (D) Quantification of oscillations of control, 100 µM palmitic acid and adipocyte co-cultured islets, occurring from 10 to 30 min after glucose stimulation. Values are averages and error bars indicate ±SEM. **** p < 0.0001; *** p < 0.001; ** p < 0.01; * p < 0.05, n = 19, 5, 14 and 12 islets in control, 50 µM, 100 µM and adipocyte groups, respectfully.